A little bit of history
Before SCOM 2007 became RTM, there were NO Monitors. Only Rules. So Alerts were fired but the monitored objects didn’t have a real ‘status’. That changed when SCOM 2007 went RTM. Rewritten from the ground up, many new things were introduced, among them the real life status of all monitored objects.
Those very same statuses came from the Monitors, a whole new concept in SCOM. You can look upon Monitors as ‘State Machines’, allowing an object to reflect the real-time health status. So primarily the function of a Monitor is to ‘change state’. Firing an Alert comes secondary. So when a Monitor changes State from healthy to unhealthy, an Alert can be fired. And when the status of the same object changes back to healthy, the Monitor will close the Alert.
As you can see, Monitors do play a significant role in the way SCOM works. This hasn’t changes at all in OM12x for that matter.
So far for the little bit of history.
Too many State Changes are BAD…
Like all good things in life, too much of anything isn’t good. The same thing goes for OM12x. So too many State Changes aren’t good at all. This is also known as ‘flip-flopping’. A certain Monitor for a certain object of a Class changes state for way too many times, like 20 (or more) times per hour.
Think about it. Every single State Change has to be calculated by one of the OM12x Management Servers, participating in the All Management Servers Resource Pool. Every State Change has to be written to the OpsMgr database AND the Data Warehouse database.
For ONE object of a Class with ONE flip-flopping Monitor that’s not too big of an issue. But imagine a Management Group with 1000+ monitored servers, 500+ MPs (many among them custom made) where MANY Monitors on MANY objects of MANY Classes are flip-flopping…
OUCH! That’s going to hurt, that’s going to bite you! So in cases like these you’ve got to know what’s going on in your environment. Because changes are your SCOM environment is affected by it, even when you don’t think it is.
How do I know I am affected?
Simple. Look for Event IDs like 31551, 31552, & 31553 in the OpsMgr event log of your OM12x Management Servers. Events like these are many times the tell tale sign that something isn’t okay in your environment since data can’t be written into the Data Warehouse database in a timely fashion.
Yes, there can be a multitude of reasons for these Event IDs, but many times it boils down to too many State Changes taken place in your SCOM environment.
The best way to go about it is to run some queries against the operational database (OperationsManager) in order to get an idea of what kind of data and how many for the State Changes is coming in. These queries enable you to pin point step by step whether you’ve got an issue going on with too many State Changes, and when so, what objects and what Monitors are causing them.
Again, all these queries are run against the OpsMgr database (OperationsManager).
Also know these queries have been posted before by other people on other blogs. So all credits for these queries should go to them or their sources (many times Microsoft CSS).
Query 1: How many State Changes are happening on a day to day basis?
This query shows you how many State Changes are taking place on a day to day basis. This way you can compare days with each other in order to identify potential issues.
| SELECT CASE WHEN(GROUPING(CONVERT(VARCHAR(20), TimeGenerated, 102)) = 1) |
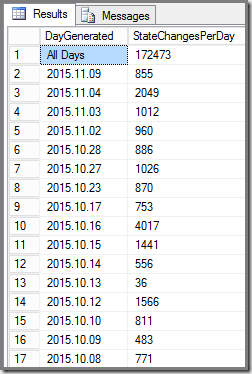
Example of the output:
Please know that in a SCOM environment which isn’t heavily tuned, the amount of State Changes per day can differ big time. Also keep in mind what kind of day it was. Was it a smooth ride or were there some outages?
Query 2: Noisiest Monitors changing state in the last 7 days
This query will show you the Monitors which generated the most State Changes in the last 7 days.
| select distinct top 50 count(sce.StateId) as NumStateChanges, |
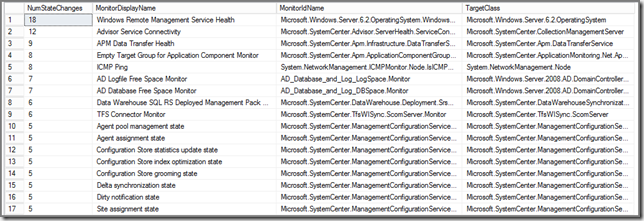
Example of the output:
So now you know what Monitors are causing the most State Changes in your SCOM environment. Mind you, this can be a whole different set of Monitors depending on the configuration of your SCOM MG.
Query 3: What’s the noisiest Monitor PER object/computer in the last 7 days?
This query shows you what Monitor PER object/computer is generating the most State Changes. I’ve seen environments where a single server was good for THOUSANDS of State Changes because the server itself was badly configured…
| select distinct top 50 count(sce.StateId) as NumStateChanges, |
Example of the output:
So now you know which Monitors on what objects/computers are flip-flopping, enabling you to exercise some good old fashioned tuning and troubleshooting with a maximum set of results!
When to run those queries?
Even when you think you’re in the clear (and you could be!), run these queries at least once per month. This way you know what’s going on in your SCOM MG. This allows you to sniff out potential issues and squash them before they get out of control.
Oh, and while you’re at it, run these queries as well allowing you an even deeper insight into the SCOM database and what’s going on.
A: Performance insertions per day
This query shows you how many performance insertions happen on a day to day basis.
| SELECT CASE WHEN(GROUPING(CONVERT(VARCHAR(20), TimeSampled, 102)) = 1) |
B: Top 20 performance insertions per object/computer per day
This query shows you what objects/computers generate the most performance insertions per day.
| select top 20 pcv.ObjectName, pcv.CounterName, count (pcv.countername) as Total |
C: How many Console Alerts are fired per day?
This query shows you how many Console Alerts per day are fired.
| SELECT CONVERT(VARCHAR(20), TimeAdded, 102) AS DayAdded, COUNT(*) AS NumAlertsPerDay |
D: Top 20 of Alerts
This query shows you the Top 20 of the most Alerts in the OpsMgr database.
| SELECT TOP 20 SUM(1) AS AlertCount, AlertStringName, AlertStringDescription, MonitoringRuleId, Name |
Help! I am NOT allowed to run those queries against the OpsMgr database OR I want to use Reports!
And right you are! In many environments the SCOM databases are only accessible for the DBA’s and not for the SCOM admins. Or you want to have reports which show you exactly that kind of information…
Gladly, there are Reports which do just that! Guess you already know the SCOM Health Check Reports V3? Even though ALL reports here are really good and very helpful, these reports in particular will cover the previous mentioned queries:
- Alerts – Top 20 Alerts
Alerts – Total Daily Misc – Config Churn Overview (drill trough) Monitors – Noisiest Monitors Monitors – State Changes per Day Performance – Performance Inserts Daily per Counter Performance – Performance Inserts Daily Total Recap
The message is clear (I hope): Run at least once per month these queries and/or Reports in order to know what’s happening in your SCOM environment. And when you’ve imported new MPs or updated existing ones, run those queries a few days before and after, so you get a better understanding of those new/updated MPs.This way you’re in control and stay on top of it all.


2 comments:
Oh, glad you reminded me about this Marnix.
After running Query 1 whilst sipping on a Hot Chocolate, I was expecting StateChangesPerDay like 100, 400, 300 etc......Well I nearly choked. Up until 3rd November that was the case, then wham!! 69k, 28k, 31k,....What's going on here????
Just when I thought all was cozy coming up to Christmas.zzzzzzzz....Marnix, you have given me work to do!!
JB
Omg, i have 50k changes for sonic esb monitoring.. nice post..
Post a Comment