How about…
checking the UPS systems, whether they’re still powered, or the batteries are being loaded or not? And at what percentage the battery capacity is and having it displayed in a graph in the SCOM Console? Or how about getting an Alert when the temperature in your datacenter is too high? And having a graph plotted near real time in SCOM about the temperature as well? Or getting an Alert when there is water detected in the datacenter?
All of this – and much much more – can be realized with SCOM, some good equipment, good software for SNMP walks (available for free like GetIf) and testing.
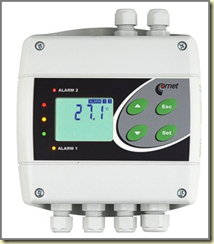
Nowadays one can buy for not too much money a data center thermometer with Ethernet connection or ‘Industrial Ethernet Temperature, Humidity, Pressure Sensors With Relay Outputs’, like this one:
Many times these devices are white labeled, thus sold under different brands. One of the real manufacturers is Comet Systems, to be found here. In the Netherlands these devices are sold under another brand, like Atal. Even though this information seems trivial it’s very important. It has everything to do with the related MIB files, about which I will tell more later on.
SNMP Get vs. SNMP Trap
Any how, devices like these are really awesome since they contain a whole SNMP stack of their own which can be queried by SCOM, using a simple SNMP Get command. The advantage of this, compared to a SNMP Trap, is that a single Monitor can be build and targeted against a whole bunch of devices. With a SNMP Trap this won’t do and per device a Monitor has to be build. Besides that there are more downsides of SNMP Traps. So whenever I can, I stay away from SNMP Traps.
White label, other brands and the MIB mix-up
As stated before, many times these devices do come from a couple of factories all over the globe. Companies buy them in masses and rebrand it under a label of their own. However, it’s necessary to know exactly what type of device you’re using so you know exactly what MIB file to use. For instance, the device in the picture above is sold in the Netherlands under a totally different label and model.
However, the same MIB still applies which only matches with the brand and models as the ones from the real manufacturer. So this is the hardest part, to search for the original label and model type. Only then you know what part of the MIB file relates to your device. But when you have tackled this, the rest is – almost - a walk in the park.
Let’s walk SNMP, some high level steps
Place the correct MIB file into the directory where GetIf loads its MIB files from. Start GetIf, enter the correct ip-address, community string and connect to the device. Go to the MBrowser tab and go through the SNMP stack, and find the OID you’re looking for, like temperature: 
Write down this OID (high lighted in yellow) since you’re going to need that in SCOM later on.
Another interesting OID in this case is for flood detection, which is an Ethernet thermometer with additional input. One of the additional inputs is the LG-12 Flood detector which works really simple and shows only two values: All is OK (no water detected) value 1 and ‘Houston, we’ve got a problem’, water detected: value 0: 
Also write down this OID.
Let’s create a Flood Detection Monitor, some high level steps
Create this kind of Monitor: SNMP > Probe Based Detection > Simple Event Detection > Event Monitor – Single Event and Single Event. 
Don’t forget to DISABLE the Monitor and enable it through using an override, targeted against the group containing all these devices! Of course, these devices need to monitored by SCOM as network devices.
Use for both SNMP Probes (First and Second) the same OID. And for Parameter Name (used in both Expressions, First and Second Expression) this entry: /DataItem/SnmpVarBinds/SnmpVarBind[1]/Value.
Configure the Health and Alerting and save the Monitor. Don’t forget to enable the Monitor by using an override targeted against a Group containing these devices.
Time for a test of the Flood Detector Monitor
Let’s say the Flood Detector Monitor is properly built and configured. So it’s time for some testing. In this case I have made two video’s and uploaded them to YouTube.
Water Alert
In the first video the flood detector is put into a paper cup with some water:
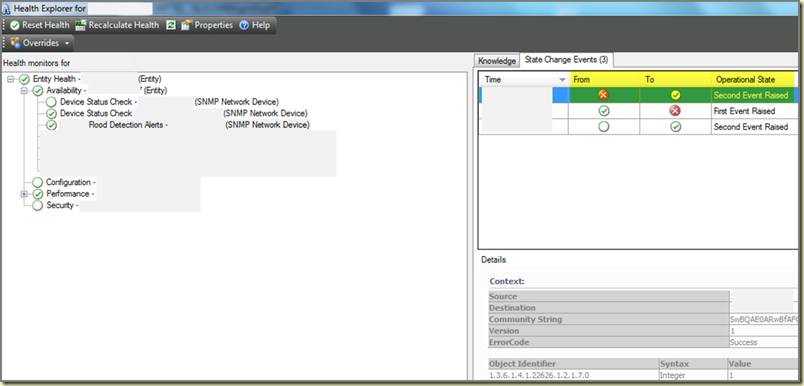
Now the circuit closes (OID gets value 0) and SCOM will raise an Alert 
Water is gone, Alert as well
In the second video the flood detector is removed from the paper cup:
Now the circuit is open again (OID gets value 1, all is well in SCOM) and the related Monitor is set to a Healthy state again, thus closing the Alert:
Let’s create a Temperature Monitor
For this the same steps are used as for the Flood Detector Monitor.
Of course, a different OID and other values are at play here. Suppose you want an Alert when the temperature of your datacenter exceeds 25 degrees Celsius. The First Expression (situation is not OK) looks like this: 
The Second Expression (situation is OK) looks like this: 
Configure the Health and Alerting and save the Monitor. Don’t forget to enable the Monitor by using an override targeted against a Group containing these devices.
And now monitoring is in place and an Alert will be raised when the temperature of 25 degrees Celsius is exceeded.
Let’s plot the temperature in near real time
For this a Rule is required, using the same OID for the Temperature Monitor: Collection Rules > Performance Based > SNMP Performance: 
Configure the SNMP Probe (nothing more than the OID and frequency of probing) and you’re done. Don’t forget to enable the Rule by using an override targeted against a Group containing these devices and you’re in business.
In the SCOM Console add a Performance View targeted against these SNMP Network Devices or targeted against the Rule you created earlier. Be patient and within an hour or so data starts getting in :).
Conclusion
Even though SNMP, OIDs and SCOM might seem boring, there are many possibilities to extend your monitoring solution into places which you didn’t expect. Many devices are available on the market which have a SNMP stack. When you have the related MIB file and it contains some good OIDs, you can build almost anything. Happy SCOMming!


10 comments:
Hi Marnix, Thx for the article. have you tried using SCOM as a SNMP Trap receiver. ? So basically having othe SNMP monitoring tools like OpenView & NetView forwarding Alerts to SCOM. ? It works in principle, but gettting Alert description to show up on the Console has been a pain.They all show up under alert Context. Please advice if you had luck with this.
Hi Mathew.
Thanks for your comments. Yes, I have tried to use SCOM as a SNMP trap receiver but the results weren't solid nor very good. So I stay away from that approach and use SNMP Gets instead.
Using SCOM as a SNMP Trap receiver has given me mixed results at best.
Cherrs,
Marnix
Hi Marnix,
Thank you for the posting this SNMP walkthrough.
A couple of pain points I have with performance based (i.e. SNMP GET or SNMP Probe based performance rules) as well as SNMP Trap or alert rules/monitors is the dreaded SNMP VARBIND or Alet Parameter mismatch errors that invariably make getting meaningful alert descriptions difficult as well as filling-up the OpsMgr log on the SNMP Proxy server with errors events.
I believe this is due to the way SCOM uses "String" as the default VARBIND type for any SNMP based rule/monitor OID variable even though the actual value being monitored/probed may be an integer as in the case of your temperature monitor example.
I really wish SCOM gave you the option to nominate the VARBIND type of the OID you are monitoring /collecting right in the wizard screen and I certainly hope SCOM 2012 will include such an option.
In the meantime, would you be able to do a follow-up post dealing with fixing SNMP VARBIND type issues with a view to getting Alert Descriptions with meaningful values parsed from a collected or monitored OID?
All the best,
Michael
Hi Micheal.
Thanks for your comment. Indeed SCOM has issues with strings (many times they should be integers). Good news is that it can be solved by editing the xml code of the MP involved.
Chris Bash has written a good posting about it how to solve it, to be found here: http://operatingquadrant.com/2009/08/13/watch-those-variant-types/
Cheera,
Marnix
Thanks for this article Marnix! As a network manager I was looking online for different SNMP Monitoring because as you know, you can't have certain operations fail. That's when I came across your SNMP walk through, you have definitely educated me on this software. I'm going to give it a try, Thanks again !
Hey Marnix,
Do you know if this device requires a license? I am actually looking for a comparable device based in the US. Thanks for your post!
Keith
Hi Keith.
Guess so but I am not really sure. Don't know exactly on what layer of the OSI model this device is queried.
Cheers,
Marnix
Hi Marnix, great articel. I have the issue that I want to monitor the registered phones on a cisco call manager. I make the monitor like you describe with first expression less than 500 an sencond expression greater than 1000. Same OID, same interval. The problem is that a critical event reised by expression one and same second the healthy state of expression two raises becaus count is 1012. Do you have an idea why expression one is raised although the count is not less than 500?
Hi There,
Nice and useful. Thanks a lot. Really appreciate this blog.
Post a Comment