Issue
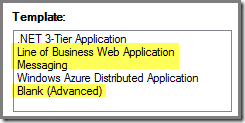
Have seen this happening multiple times. A DA is created using one of the highlighted DA templates and one of the DA components gets into a critical state but the DA itself doesn’t reflect that. Instead it stays in an Healthy state
Example
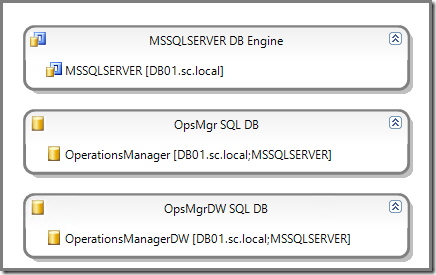
I’ve created a sample DA - using the Blank (Advanced) DA template - consisting out of three components, reflecting the SCOM 2012 R2 SQL databases and the related SQL DB Engine:
I haven’t added any relationships. IMHO these don’t add any real value and only introduce clutter. This DA is titled Test.
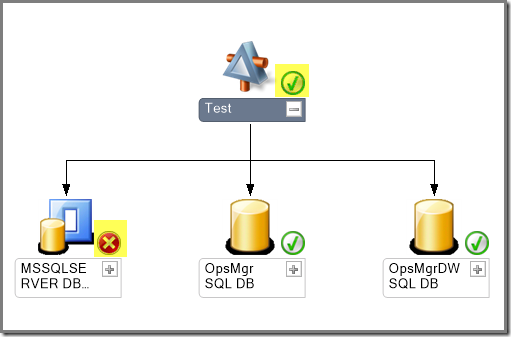
When saved it soon gets a status which depicts the issue of this posting:
As you can see, the DA Component MSSQLSERVER DB Engine has a critical state. And yet, the DA itself (TEST) has a Healthy condition. And no, this WON’T change after some time at all. So there’s something else at play here.
Time to investigate
Let’s open the Health Explorer since this way we’re going to see more detail about the monitoring itself.
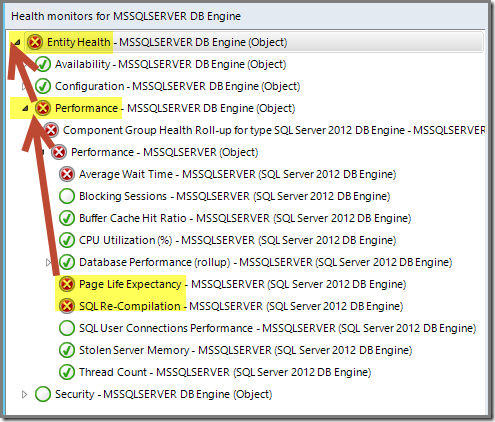
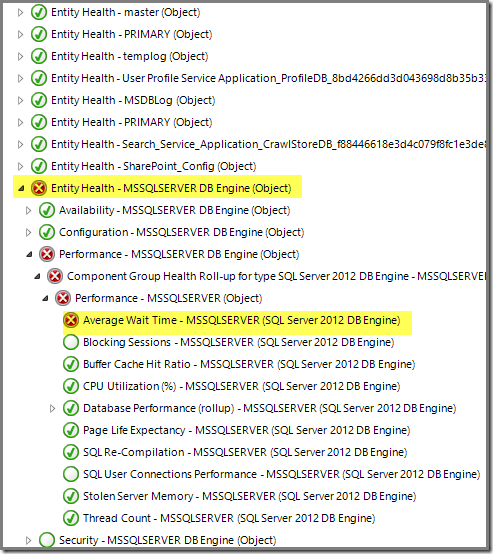
Health Explorer for the DA Component MSSQLSERVER DB Engine (filter removed):
This looks good. The top level entity (Entity) get’s it health state from ALL four well know Aggregate Monitors (Availability, Configuration, Performance & Security). That is, when the Unit Monitors rolling up to those Aggregates are present AND turned on.
So far so good. Two Unit Monitors rolling up to the Aggregate Monitor Performance are in a critical state, rolling all the way up to the top level entity itself. Nice! No issues here. Monitoring is taking place as expected.
The cause
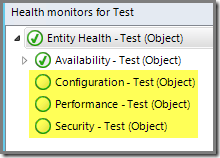
So the reason why the DA Test doesn’t reflect this state is somewhere higher up in the chain.Time to check the Health Explorer for the DA Test itself (filter removed):
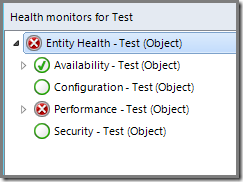
Uh oh. This doesn’t look good at all. I want the DA to reflect the status of ALL Monitors no matter to what Aggregate Monitor they rollup to. Only to have the Aggregate Monitor Availability enabled is far too limited. So apparently we’re getting closer to the cause here.
But be careful now, because you might be tempted to make the wrong call here.
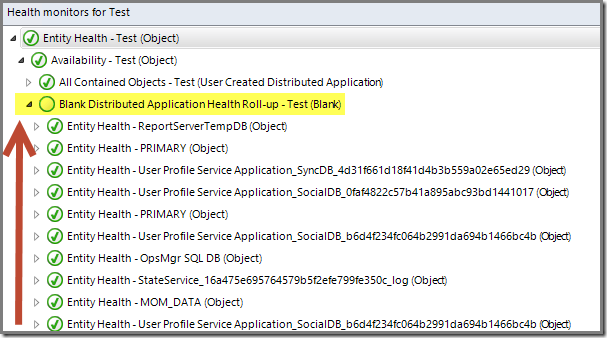
Some levels lower of the Aggregate Monitor Availability there is a Dependency Monitor taking all other Monitors used by the DA components into account, like this:
As you can see this Dependency Monitor, titled Blank Distributed Application Health Roll-up – Test (Blank), has no status. So all Entity Health states as depicted in the same screenshot don’t have any effect what so ever, even though they themselves do have a status.
And when you take a deeper look under the same Dependency Monitor, this is what you’ll find:
At this point you might be tempted to make the wrong decision here by enabling the Dependency Monitor Blank Distributed Application Health Roll-up – Test (Blank) through an Override (Enabled = True).
But that’s not the way to go at all!!!
Why?
There are many reasons for it. The most import ones however are:
- Many of the Unit Monitors rolling up to this Monitor are already rolling up to the Dependency Monitor All Contained Objects. So much of the monitoring will be happening twice. Which is bad.
- The Aggregate Monitors Configuration, Performance and Security will stay stateless since everything rolls up to the Aggregate Availability. And sooner or later the people using this DA will start complaining about it and they’re right. They want to see what goes wrong on what level, whether it’s Availability, Configuration, Performance or Security. Everything rolling up to Availability is a bad call.
The ONE & ONLY Solution
The ONLY way to go about it, is to build the missing Dependency Monitors, one for every three remaining Aggregate Monitors (Configuration, Performance & Availability).
That way all will be just fine. You can even choose to do so for every DA component involved – which takes more time – but you can also choose for the more relaxed way where you built ONE Dependency Monitor per Aggregate Monitor to which all related Unit Monitors of all DA Components rollup to.
Example
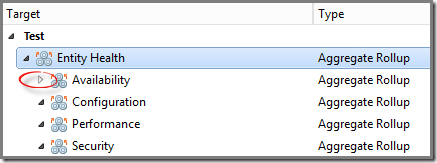
In this case I have the DA test and opened it in another View in the SCOM Console. Simply close the Health Explorer and go to Authoring > Management Pack Objects > Monitors > Change Scope > View all targets > Clear All and select only the DA having these issues. In my case it’s the Test DA. Now you’ll see something like this:
The fact that Availability has a white triangle pointing to the right means only this Aggregate Monitor does actually have a rollup. The other Aggregate Monitors don’t and depict a black triangle instead. Time to change it ![]() .
.
But let’s first take a better look at the Dependency Monitor we want to recreate.
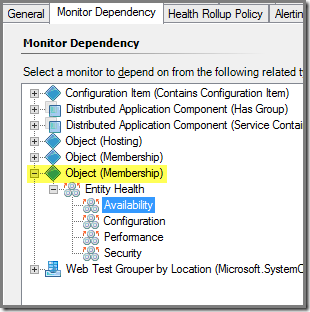
- Expand Availability > double click the Dependency Monitor All Contained Objects > check the tab Monitor Dependency and take note of the Object it depends on:
The same Object (the second Object (Membership) in this case) will be used when we’re going to create our own Dependency Monitors. - Do the same for the tabs Health Rollup Policy and Alerting. Also note their settings. Now we have enough information to start. In this example I’ll build the Dependency Monitor for Performance since that’s the one with a Critical state not rolling up to my DA
 .
. - In the same part of the Console (Authoring > Management Pack Objects > Monitors and your selected DA) click right on the Aggregate Monitor Performance > Create a Monitor > Dependency Rollup Monitor;
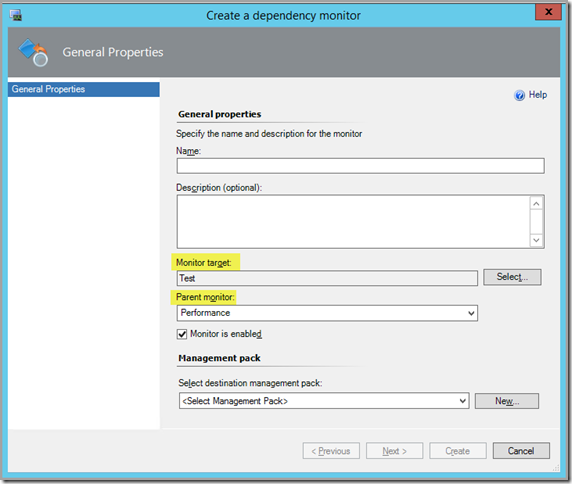
- Because you started this wizard from the Aggregate Monitor Performance of the proper DA, the fields Monitor Target, Parent Monitor will be filled out already for you:
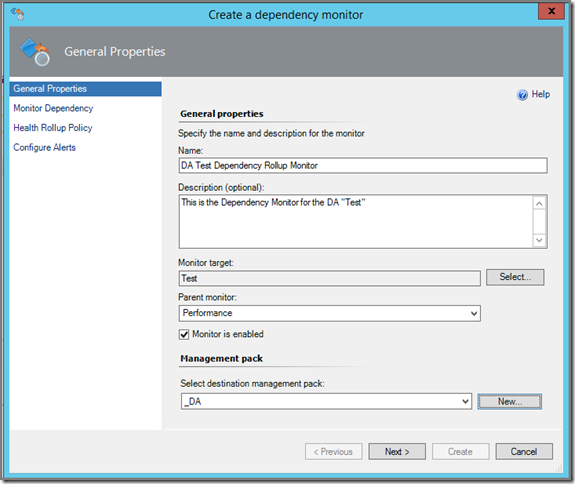
Enter a proper Name, adhering to your naming conventions and select the SAME MP as where the DA resides. Now your screen looks like this:
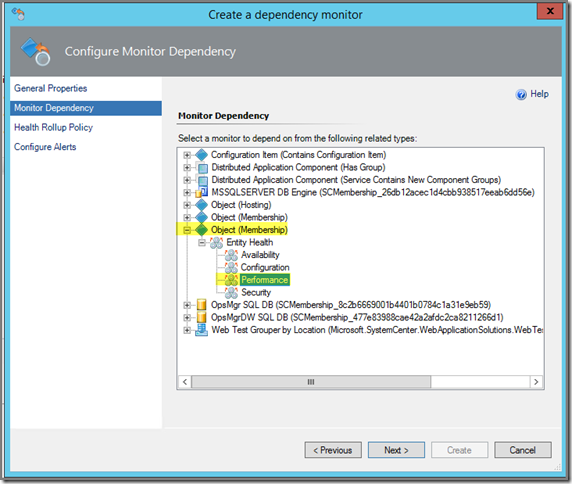
> Next; - Select the same Object as found in Step 1 but now you select the Aggregate Monitor Performance
> Next; - Select the same Health Rollup Policy (Worst state of any member) > Next and configure the Alerts (none) > Create.
- Now the Dependency Monitor will be created and soon SCOM will be ready. Wait a moment and then open the DA again in Diagram mode:
- Open Health Explorer for the top level entity:
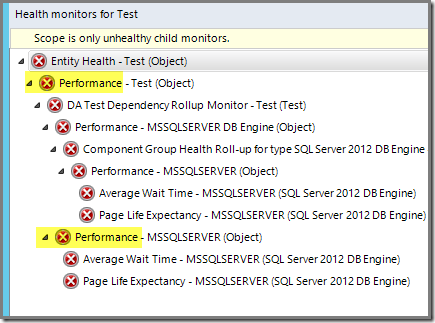
Looking NICE! Let’s remove the filter:
As you can see, the Aggregate Monitor Performance has a state now for the top level entity. AWESOME! - Repeat Steps 3 to 6 for the Aggregate Monitors Configuration and Security as well. This will result in these Aggregates rolling up to the top level entity of the DA as well (many times the Aggregate Monitor Security doesn’t get a status since there aren’t any Monitors rolling up to it, so don’t be disappointed).
Recap
Since SCOM 2012x the DAs are said to rollup to ALL 4 Aggregate Monitors. However, the three highlighted DA templates come from SCOM 2007 R2 and aren’t ported to the new world.
This results in wacky DAs breaking down the overall experience. The .NET 3-Tier Application DA template however works (PARTIALLY!) as intended with SCOM 2012x since this is a new DA template introduced for APM which is new in SCOM 2012x.
However, the same template isn’t really nice since it throws in naming schemes which aren’t that good and seems to have an issue with the Aggregate Monitor Availability which is disabled by default.
Therefore I prefer to build my own DAs using the Blank (Advanced) DA template WITH creating the three missing Dependency Monitors for the three Aggregates later on. That way I am totally in control of what’s happing ![]() without taking a deep dive into MP authoring tooling outside the regular SCOM Console.
without taking a deep dive into MP authoring tooling outside the regular SCOM Console.


3 comments:
I'm following these steps, but when I create the new dependency monitor I get an error...
: Database error. MPInfra_p_ManagementPackInstall failed with exception:
Cannot add ManagementPackReference ManagementPack:[Name=Distributed.Applications, KeyToken=, Version=1.0.0.0]. Unsealed management packs cannot be added as references. Specify a valid sealed management pack reference.
I'm think it's saying the DA I'm referencing is in an unsealed MP (true) but I'm authoring it, so of course it's in an unsealed MP. Sort of confused how to proceed from here. Do I have to seal my DA MP before I make these monitors? That seems like it would be a burdensome workaround.
A bit of a late post but.. Distributed Applications are ment to show availability hence why only availability rolls up, the reason for this is that you might want to have monitors that doesn't really affect the availability of an object and you might want to differentiate the monitors. When you design Management Packs it's important to consider what type of monitor it is, wheter it affects availability or not as this will be the base for most state aware functions such as DA's or SLA reports.
Hi Ronnie.
No worries. Thanks for your comments. However, I don't agree here with you. When looking at the DA Templates which were added in OM12x, you'll see the other aggregates do have a rollup.
Also a DA only reflecting the Availability is missing out on a whole lot of crucial monitoring information. Many of my customers want DAs showing the full health and not a small subset of it (Availability).
So therefore I've shared this experience and I must say that many customers of mine use this today in order to get the most out of their DAs.
So perhaps Microsoft intended DA's originally to show only Availability health, but when OM12 became GA, the newest DA templates reflects Microsoft's change to this.
Cheers,
Marnix
Post a Comment