Thursday, June 30, 2011

Distributed Applications (DAs) – Part IV: Tips & Tricks

----------------------------------------------------------------------------------
Postings in the same series:
Part   I - Why use them?
Part  II - How about DAD?
Part III - Do’s and Don’ts
----------------------------------------------------------------------------------

First some background information about the reason WHY behind this series
This posting is for me personally the MOAP (Mother Of All Postings) since it took me four to five weeks to collect all required data, check, validate and double check them and document everything in a proper way.

But it’s time well spent. Actually, this collection of Tips & Tricks about DAs triggered a new series of postings (Postings 1 to 3) instead of a single posting since I wanted to put everything described in this posting in the proper perspective. So when you haven’t read the first three postings, please go back and read them first in order to get the most out of this series.

About this Posting
In the fourth and last posting about DAs I will share some experiences and lessons learned. It’s good to know that some of these lessons were learned by other colleagues/project team members (like Arthur Nieuwland), where others were learned by myself. So this posting is the result of the ‘blood’, sweat and tears shed by many people. Without the input of us all this posting wouldn’t contain 17 items, which makes this latter posting true to the real spirit of the community: it’s all about sharing.

!!!Spoiler Alert!!!
Some of the items might be well known where as others might be totally new. Item 17 is really really something special. It’s a BOMBSHELL!!!

Let’s start since it’s a long long list.

  1. DAD freezes many times while I am working with it
    Basically what’s happening is this: One is working in DAD and wants to add an Object to a new or existing Component (Group) by using the Object Picker.
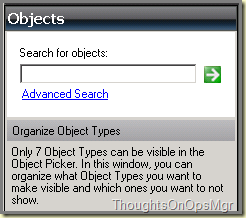
    image
    And when one hits enter, all seems to be just fine. Until one selects an Object in order to add it to a Component (Group): DAD freezes. Totally.
    Cause
    Many people might think SCOM is broken. But that’s not the case. What happens is that SCOM kicks of a query in order to enumerate ALL Objects which relate to the Object you’re looking for. This a generic query. But when one adds an Object to a Component (Group), SCOM kicks of a second query in order to enumerate ALL the Objects which are similar to the one which you just added to a Component (Group) since DAD wants to add a ‘Wunder Bar’ containing all these Objects.
    image
    Under normal conditions this is OK. But when there are ‘tons’ of Objects, like logical disks, network interfaces (when a network MP is in place) this causes SCOM to hang. Big time.

    Workaround
    Easy. Saturate Object Picker (with 7+ Object Types) in order to work around a frozen DAD. How? Simply add new Component Groups to your DA (give them names like 1, 2, 3 etc etc) by selecting Objects which aren’t present in big numbers in your SCOM environment. Per NEW Object Type DAD will create an additional Wunder Bar. So the game is that you need to add a different Object per Component Group. Otherwise DAD won’t create a new Wunder Bar. You must add new Components until you’re shown the Replace Visible Object Type screen:
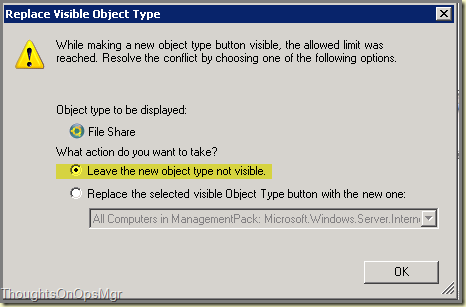
    image

    Object Picker will show 7 Wunder Bars now:
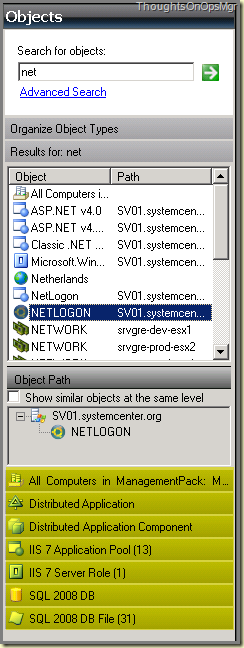
    image

    In the Replace Visible Object Type screen, leave the default option selected (Leave the new object type not visible) and click OK. Now the Object Picker is saturated and one can select the Objects which are present in the SCOM database in huge numbers without freezing DAD. When all Objects are added to your DA remove the ones you don’t need and save the DA. May cost some time but when one gets the hang of it, it certainly beats the time lost when DAD freezes (again).

  2. DAs don't show items any more but group them
    When a DA contains 7+ Components (or Component Groups) they won’t be shown separately but grouped together like ‘Healthy’, ‘Not Monitored’, ‘Warning’ etc etc. This is by design. Cameron Fuller pointed this one out a while ago and his approach is the one I use as well: split DAs into multiple layers, Also see posting Part III about DAs, 3rd bullet Divide and Conquer.

  3. When I want to add a component to a DA it takes ages for the 'Create New Component Group' screen to load
    image
    Funny thing, the Add Component button kicks of a query which enumerates all Objects Types present in the SCOM database. This query isn’t really fast so it takes a lot of time in big SCOM environments. Therefore it takes a ‘while’ before the  Create New Component Group screen is shown. Same thing happens when one wants to look at the properties of a Component (Group) which already exists. For the latter there isn’t a workaround, for the first situation there is. Don’t use that button but the Search for objects screen instead:
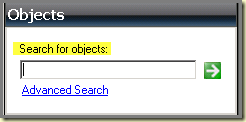
    image

    When the Object is found, right click it and select the option Add To. Depending on your DA and the Component (Groups) already present one can choose between New Component Group or existing Component (Groups):
    image

  4. When I create a relationship between two or more Component Groups in a DA, what happens underwater?
    Common mistake: when adding a relationship ('Create Relationship' button) it won't create a Monitor (or alter an existing one for that matter). ONLY a relationship will be created. Nothing less, nothing more.

  5. Should one use Relationships or not?
    Relationships are more a visual item than anything else. Take a look at these two pictures. The one on the left is the DA without a Relationsship between Database 1 and Database 2 whereas the picture on the right shows the same DA but now with an added Relationship.
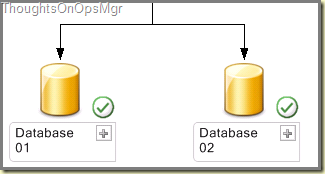
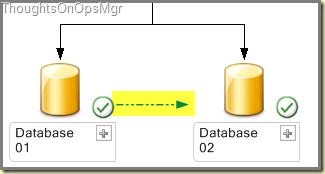
    image  image

    One could say the latter picture clarifies the relationship, but that's the whole point of any DA already. Somehow the Components relate to each other. If there wasn't any kind of Relationship at all, those very same Components shouldn't be in the DA in the first place. Also, when the DA consists out of multiple components there are already enough lines between all those components. The credo 'Less is more' comes into play here. So personally I don't use Relationships that often.

  6. Let's query the SCOM database!
    The 'Advanced Search' link can be very helpful. Use it and be surprised. Works way much faster compared to the earlier mentioned Add Component button .

  7. I want to check out the settings of the Monitors created by DAD. Is there a quick way to do this?
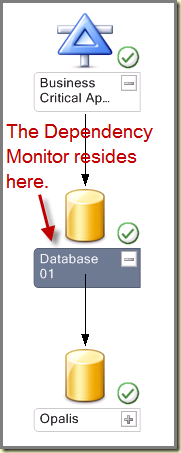
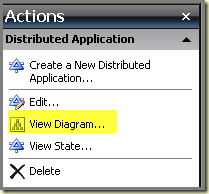
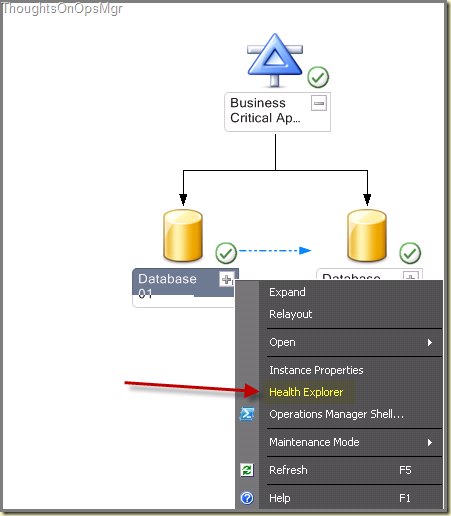
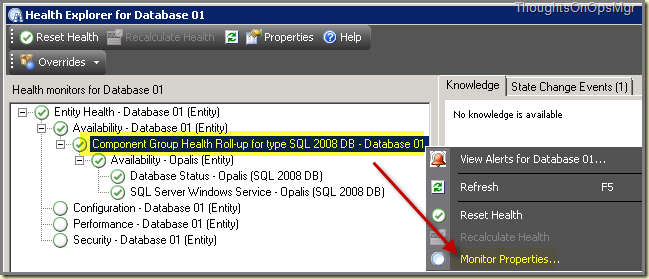
    When altering settings of the Dependency Monitors (created per DA and per Component Group) it's better to open the Diagram View of the DA.
    image
    image
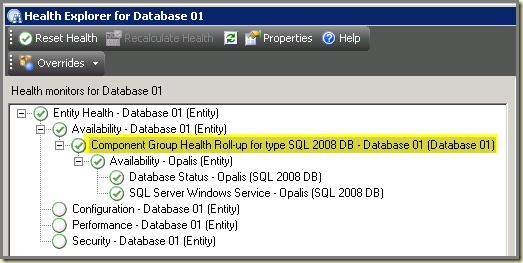
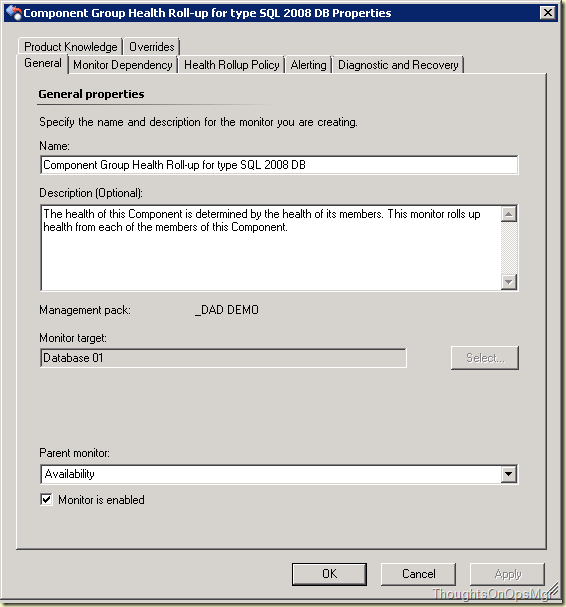
    Right click on any Component Group and open the Health Explorer. From there any Monitor can be opened and adjusted as required.
    image
    image

  8. How Health Rolls up
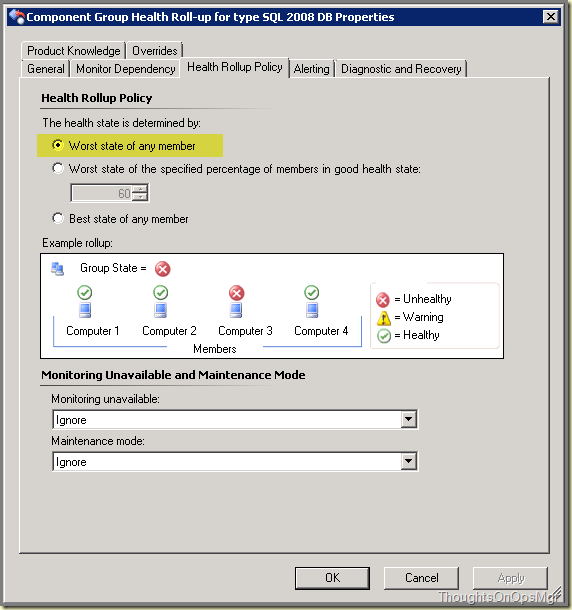
    By default, the Health Rollup Policies of the Dependency Monitors of the DA and Component Groups are set to 'Worst state of any member'. In many situations this is OK, but through overrides it can be set to other states as well.
    image
    Suppose you are monitoring the redundancy of some Objects like services, four in total. Only a critical situation arises when 3 or more services go down. Here the Health Rollup Policy must be changed to 'Best State of any member'. Adjust it as required > Apply > OK and be done with it.

  9. When the 'flow' isn't working or how to redirect it...
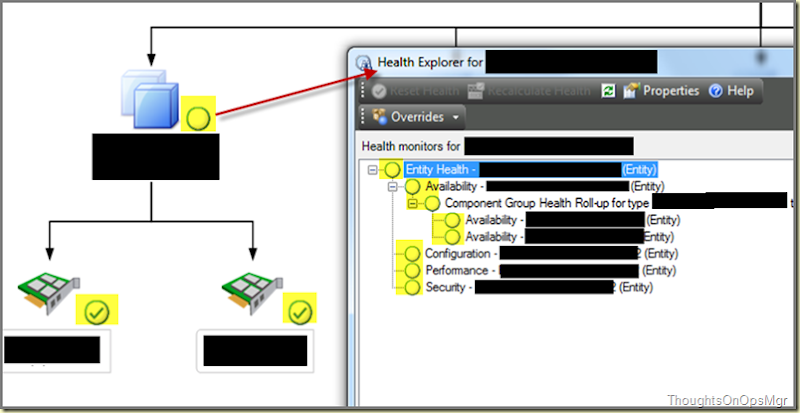
    Sometimes you create a DA which doesn't work. Health doesn't rollup. When looking at the DA in Diagram View, the top level or some sublevels (the Component Groups) are in an unmonitored status. When you expand the Diagram further, many times you'll see that the underlying components are OK: they're monitored. But why doesn't the status rollup? 
    image

    This is where Health Explorer comes into play. Simply because the Diagram View only displays the looks of the DA and Health Explorer shows you what is happening under water. As stated before, the Dependency Monitors (residing at DA and Component Group level and created by DAD) are targeted against the Parent Monitor 'Availability'. But sometimes the monitored Objects, like network interfaces of network devices monitored by Jalasoft Xian IO, don't do very much with that Parent Monitor. In this particular case all the Monitors are grouped under the Parent Monitor 'Performance'. So some additional tweaking is required in order to get the flow running again.
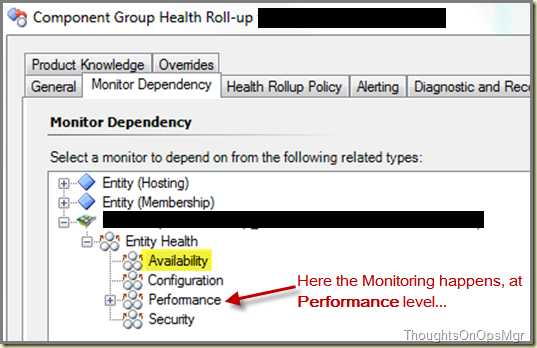
    image


    In this case the Dependency has to be changed (NOT the Parent Monitor) from 'Availability' to 'Performance'. Save your changes and soon all will be fine in a few minutes.
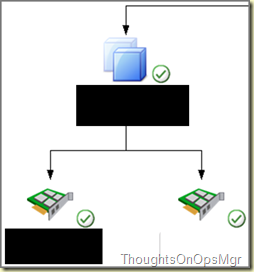
    image

    This trick can also be used when a particular Class is added to a DA of which the stakeholders tell you that some Performance Monitors are more important to them. Another approach would be to set the Dependency at ENTITY level. This way all four Parent Monitors (Availability, Configuration, Performance and Security) will be used.

    Another approach could be more granular. Suppose you're monitoring an Object which involves tons of Monitors. Changes are that all those Monitors aren't required in your DA. So it's better to select only that particular Monitor which is important to that DA.This can be done by changing the Dependency of the Monitor by selecting the single important Monitor.

  10. Do You Want it ALL or just the Important Bits?
    Many times when building DAs one is attempted to use whole entities like Windows Computer, Network Devices, SQL Computer and the lot. Many times however the details are the most important things. So it better to go a more granular level like the disk space of a certain disk drive, a certain SQL DB or a certain Service/Process.

    Also because many organizations have carved their ICT into departments as well. One department is responsible for hardware, the other for the Virtual infrastructure and SAN, another for the databases and another department for a certain set of services/applications. So the DA has to reflect that as well.

    No point to create a set of DAs for application owner which will raise Alerts for the related Computer Objects as well since Alerts like that are meant for another Department. This way a DA will die soon since it gives too many false-positives. The server itself might experience issues but those very same issues won't necessarily affect the service/application. Therefore, differentiate in you DAs in order to reflect the ICT departments and their related responsibilities. And keep in mind for whom you're building that particular set of DAs. The overall quality of SCOM is judged on the QUALITY of the Alerts not the QUANTITY...

  11. Don't open Health Explorer of the DA itself
    Many times a single DA contains some or more Component Groups. Per Component Group one or more Objects are added. When the Health Explorer of that DA is opened, it will aggregate ALL Health Explorers of ALL objects present in that very same DA. This will bog down the overall performance of SCOM, so it's better NOT to open the Health Explorer of any DA. An alternative is to open the DA in Diagram View (which can already take some time depending on the size of the DA), use the button 'Problem Path'. Now the Object with the problem will be shown. Select that Object and open Health Explorer on that level.

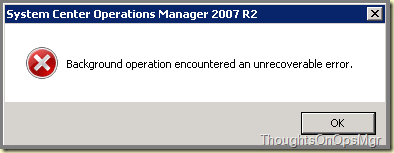
  12. Error 'The value does not fall into the expected range' when opening/closing DAs
    This error puzzled me for some time. But I think I know the two most plausible reasons behind this error:
    • DA is defect
      This bad. Remove it and rebuild it. This doesn't happen many times though, 1 time out of hundred times this error is thrown. When it happens many more times to you, changes are you're experiencing issues with SCOM like a database issues for instance.
    • DA was still loading and being enumerated in the background but the screen of the DA is closed
      Some DAs are big and (especially top level DAs or big aggregate DAs) so SCOM is busy enumerating all the Objects within those DAs. Sometimes those enumerations time out or, when the screen is closed, are cut off in between which generates the earlier mentioned error.

      How to differentiate between a defect DA or the enumeration issue? Easy. Just open the DA in Diagram View. When the above mentioned error is thrown while the Diagram View is opened, changes are the DA turned sour. When the DA opens neatly in the Diagram View, the DA itself is OK. Of course, give a DA time to land. So when it's build and saved wait some time (like 10 to 20 minutes) before opening it in Diagram View.

  13. Error 'Verification failed with [x] errors' when removing a DA
    This error occurs when one tries to remove a DA which is put into another DA as a Component Group. So remove the DA from the other DA(s) and save the changes. Now the DA can be removed without any error message.

  14. I have a DA in place so now I can run reports against it, can’t I?
    Nice one! The answer is No and Yes. Why? First of all creating a DA doesn't create any Rules. None. So for any given DA no data collection for Reports takes place. So that's the No.

    The Yes comes into play when taking a look at the Objects which are part of that very same DA. Suppose you add one or more SQL databases in a DA. Against these very same databases, collection of data for Reports already takes place. So against Components like those one can run Reports and be successful at it. But pure technically this is outside the scope of the DA and only so because that Object has some collection Rules running against it, all taking place outside the DA itself.

  15. Based on item 14: How to run Reports against certain DA Components?
    Open Reporting and click till you drop? Based on trial & error you should come a long way. But it takes too much time, effort AND frustration. Gladly there is far more better way. By using the Diagram View of the DA in conjunction with the Targeted Reports option.
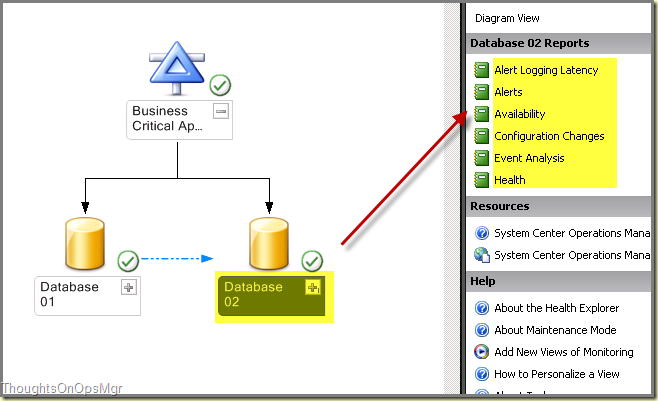
    image
    This way one can select an Object of any given DA and the Action Pane will show the related Reports. Another advantage of this approach is that SCOM will do a lot of work for you, like selecting the correct Classes for the Report. This step can be hard to grasp so it's good SCOM does the work for you :). Just try and be surprised.

  16. My Group is GONE?
    Sometimes it’s better to use Groups in order to populate Components in DAs. But when a Group is added to a DA the very same Group won’t show up anymore in the Groups view of the Authoring Wunder Bar in SCOM. This is by design so don’t start doubting yourself. When you want to edit the Group, you have to remove it from the DA, save the DA and within a few minutes the Group will be shown again in the Authoring Wunder Bar under Groups. Now you can edit it.

  17. Can I put components from other unsealed MPs into a DA which resides in another unsealed MP?
    Officially, No. You can’t because an unsealed MP can’t reference another unsealed MP. You’ll get this error message when you save the DA:
    image
    image
    And:
    image

    But unofficially, there is a workaround!
    Got this from the highly respected project team leader, Arthur Nieuwland. Really a good trick it is. Awesome! 

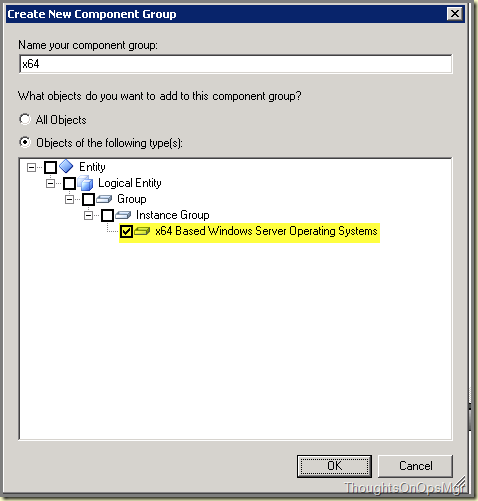
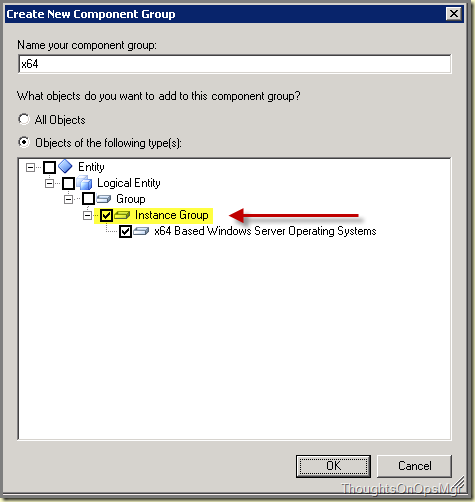
    Let’s go back to the first screen Create New Component Group. But instead of the most specific level (x64 Based Windows Server Operating System), which resides at the UNSEALED MP level (which is another unsealed MP than the unsealed MP where the DA resides), you select one level higher which resides in the core MP of SCOM, which is a SEALED MP.

    So now the unsealed MP, containing the DA references a SEALED MP, which is allowed!

    Like this: 
    image

    Now the Object can be added and the DA saved. All is well now: 
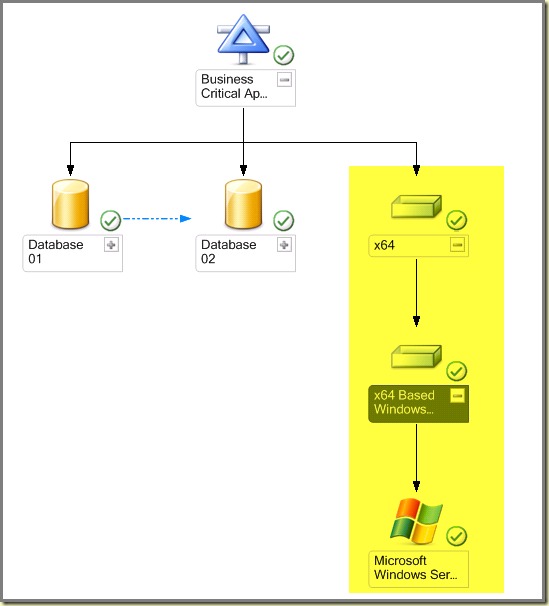
    image

As you can see, there is a lot more to DAs one would first expect. When one follows the guidelines described in the this series of postings, DAs can become a great asset to your SCOM environment, thus enabling SCOM to deliver more bang for the buck. Enjoy creating DAs but keep in mind that good planning is required in order to get it right. Happy SCOMming!
Tuesday, June 28, 2011

Error when running the Free Space Report: Cannot initialize report.

The Logical Disk Extension MP contains two great Reports. Many customers of mine use it on a monthly basis. And I must say, it really adds value to any SCOM environment.

Today I bumped into the situation however where the Free Space Report didn’t work. It threw this error: Cannot initialize report. OK, so something was wrong. But what? The error message itself didn’t reveal anything useful about the reason why the Report failed so it was time for more investigation.

I opened the SQL Server Reporting Service url in IE and started the same Report. Reason behind it is that this way more information will be displayed. And yes, now I had something more to go on:


An error has occurred during report processing. (rsProcessingAborted)
Query execution failed for data set 'SelectGroup'. (rsErrorExecutingCommand)
Invalid object name 'OperationsManagerDW.dbo.vManagedEntity'.
 

Especially the last part of the error message told me a lot: the name of the Data Warehouse is hard coded in this MP. This particular customer runs special names for the OpsMgr databases, including the Data Warehouse. So there is a mismatch. It was time for some XML-editing.

I opened the MP in Notepad++ and replaced all OperationsManagerDW entries with the correct name of the Data Warehouse database. Also raised the version number and edited the Description as well in order to reflect the modifications. Removed the old MP, removed the Reporting part through the web browser and imported the adjusted MP.

And now all is just fine: the Free Space Report runs like a charm.

So whenever you bump into a similar issue check the name of the Data Warehouse database. Changes are the name isn’t the default one. Follow the earlier mentioned procedure and be happy.

Monday, June 27, 2011

Distributed Applications (DAs) – Part III: Do’s and Don’ts

----------------------------------------------------------------------------------
Postings in the same series:
Part   I – Why use them?
Part  IIHow about DAD?
Part IV – Tips & Tricks  
----------------------------------------------------------------------------------

In the first two postings of this series I talked about DAs in general and what role DAD (Distributed Application Designer) plays here. The third posting in this series will be all about the do’s and don’ts when creating DAs. There is much to tell, so let’s start.

Do’s and Don’ts
Would be cheap to start a header with the Do’s and another with the Don’ts since these two are the opposite of each other so I have grouped them together under one header. I leave it to your imagination whether a certain item is to be grouped under Do or Don’t :).

  • Communicate
    When you create a DA you want it to be successful. The DA will be created in order to serve a certain purpose so it’s key to communicate with the stakeholders in order get a clear picture about:
    • Out of what components/servers/services is their service/application made of?
    • What do they expect from the monitoring solution? (Manage their expectations as well. (Better to start small and grow bigger than to start with a castle and deliver a plain house. The latter won’t be understood and kills the DA in the process since it doesn’t live up to the expectations.)
    • What do they want to be monitored?
    • Do they need monitoring on a functional and/or technical level?
    • What do they expect to see in their Monitoring Views? Performance Views? Alert Views? State Views? Diagram Views? Dashboards?
    • Do they expect integration with SharePoint?
    • Do they expect third party tools like Savision LiveMaps or – closer at home - Visio?

  • Documentation
    • Write down what has been communicated;
    • Make some mock-ups like drawings (PowerPoint is a great tool here) so the stakeholders know whether what they told landed properly. It’s easier to change a drawing than chancing a lot of DAs;
    • Based on the drawings you’ll also know what’s already in place in SCOM and what isn’t. This way a list of action items can be created in order to cover those as well (or not, based on the required investment in order to get the missing objects into SCOM).
    • When the initial building of the DAs starts, document it like the DAs, Components, whether some Monitors have been changed or not.

  • Divide and Conquer
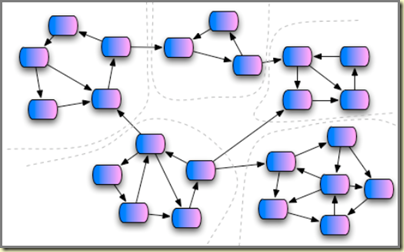
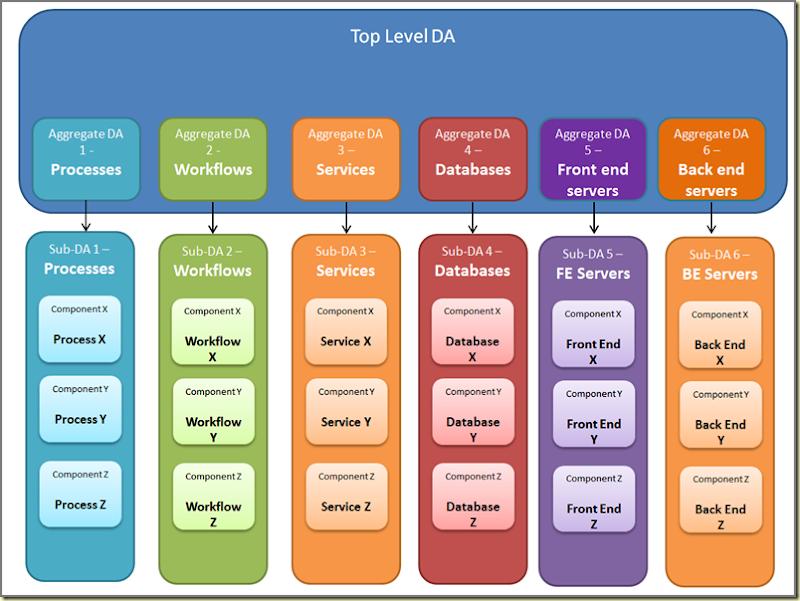
    When creating a DA covering a certain service/application look at your mock-up: can it be covered in one DA? Or is better to work with Top Level DAs, Aggregate DAs and Sub-DAs? This way a service/application can be cut down into the parts that are crucial like certain services, databases, scheduled jobs, workflows and so on. When something goes wrong with a certain part, it’s easier to pinpoint the issue as well.

    Again, PowerPoint can be a great aid here, like this:
    image 

  • Naming conventions, Descriptions, Management Pack, Versioning
    • Naming Convention
      When creating DAs and Components keep in mind that Objects will be created. For SCOM the name isn’t leading but the GUID. So one can create tons of Objects (DAs and DA Components) with the SAME name! This creates much confusion. Therefore think up a naming convention so every DA and DA Component gets a unique name WHICH also tells what it’s meant for.
    • Description
      Every DA has a field for a Description. USE it! Seriously. This way you’ll still know the what the DA was meant for, even after a year. Also think up a convention here so the descriptions will have the same syntax.
    • Management Pack
      Put the DAs and the lot, meant for covering a certain service/application into a dedicated MP. That way the DAs and its related components can be used to their fullest extend.
    • Versioning
      I know. Version numbers are only enforced in SEALED MPs. But even in unsealed MPs version numbers play an important role. This way one knows what is happening with the MP containing all the DAs. It goes without saying that Versioning only works when good documentation and saving/keeping the previous versions is looked after as well.

Basically, when you want to create crappy DAs which are short lived and looked upon something nasty to be found under your shoe, DON’T communicate, DON’T document, put everything in ONE DA, DON’T use naming conventions, descriptions, versioning and don’t design anything. Just open DAD and be surprised how fast a flawed DA is created! In the matter of seconds! :)

In the fourth and last posting in this series I will share some good tips and tricks, like avoiding some potential pitfalls and how to get the ‘flow’ (health rollup) going when things seem not to work as intended.

Wednesday, June 22, 2011

Distributed Applications (DAs) – Part II: How About DAD?

----------------------------------------------------------------------------------
Postings in the same series:
Part  I – Why use them?
Part III -  Do’s and Don’ts
Part IV – Tips & Tricks
----------------------------------------------------------------------------------

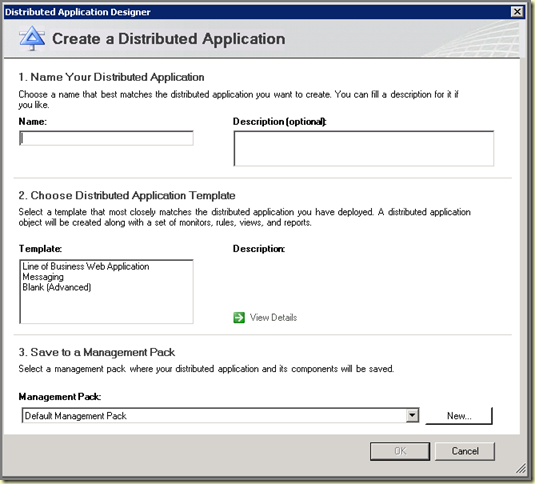
Before taking a deep dive into DAs and how to get the best out of them, one must understand how DAs are build. Of course, it’s done by the wizard named DAD (Distributed Application Designer). But what is really happening? What does DAD do?

Actually, DAD is a busy little fellow. While we’re dragging and dropping Objects in DAD, it’s is creating Objects, their related Discoveries, Monitors and the lot. Only when one understands what is happening, good DAs can be build, properly managed and – when needed – potential issues solved. This second posting in this series about DAs will be all about DAD. Let’s start.

Let’s build a DA
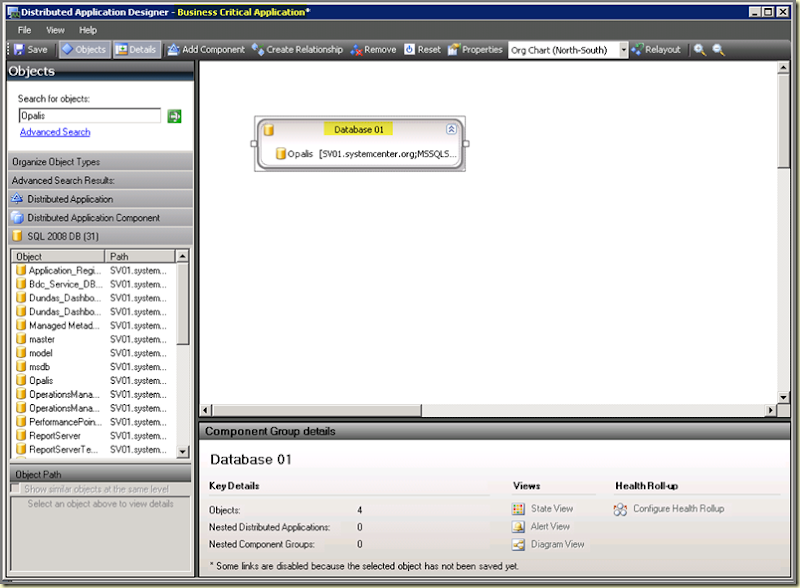
First I will create a simple DA with only one Component with one Object, a SQL Database. This DA will be saved into a MP of it’s own. Some information:

  • DA Name: Business Critical Application;
  • Component Name: Database 01;
  • Object in Component: Opalis (SQL database);
  • MP for this DA: _DAD DEMO

image

What has DAD done?
A lot actually. Every Component in a DA is looked upon as a Class. Also the DA itself, is looked upon as Class. So in this case we have one DA and one Component, so their are two Classes. But a Class can’t simply exist. It needs to be discovered. Therefore, per Class a Discovery is created as well. But some monitoring is required as well. So per Component a Monitor is created as well. (Later on in this series I will talk more about the kind of Monitor DAD has built and why.)

Of course, the reason why one builds a DA is to group some or more Objects (Classes) logically together. So there are some Relationships as well. Per Object (Class) a Relationship is created. In this case we have two Classes, so there are two Relationships as well. And last but not least, there are Dependencies as well of course.

The Dependencies tells the DA what other MPs it requires in order to function. Based on what Classes are put into a DA, like SQL databases, IIS websites, VMware VMs, Windows 2008 Servers and so on, the list of Dependencies will be built. By default there will be four Dependencies (all libraries) present in any DA, all coming from the core MPs of SCOM itself: System Library, System Center Core Library, Health Library and the Distributed Application Designer Library.

Breaking it down it looks like this:

  • Classes
    • 01: Business Critical Application
    • 02: Database 01
  • Discoveries
    • 01: Distributed Application Membership. Targeted against the DA itself. Discovers the DA Components which are member of this DA.
    • 02: Component Membership Discovery. Targeted against the DA Component Database 01. Discovers the Objects which are member of this Component.
  • Monitors – Dependency
    • 01: Component Group Health Roll-up for type SQL 2008 DB. Targeted against the SQL database. This Monitor resides at the DA Component level, in this case at Database 01 level.
  • Relationships
    • SCIMembership_<GUID>. This one has the DA itself (Business Critical Application) as source.
    • SCIMembership_<GUID>. This one has the DA Component (Database 01) as source.

The names of the Relationships can be a downside. Why? Normally one doesn’t need to alter the xml-code itself. But sometimes it’s needed. Since the Relationship names uses GUIDs names will look like this: SCMembership_69f8ba4473bf4275820d5ede9bbac4c1 which isn’t very easy to remember. Nor does the name tell you what source that particular Relationship uses.

This behavior (using GUIDs in names for Relationships but Monitors, Rules and Discoveries as well) is found throughout the SCOM Console when building anything. The only way to workaround it is to use the MP Authoring Console, or to edit the XML-code afterwards and replace all GUIDs by more friendly names. In the last case one can wreck the whole MP…

Ok. Now I know what DAD did. Now what? What is it to me?
Like stated before, DAs can really add value to your monitoring solution. But in order to get the most out of it, one requires a thorough understanding of DAs. Now we know that when a DA is build, new Classes have been added into SCOM. Classes with a State. Classes which can be used in other situations as well, like dashboards for instance.

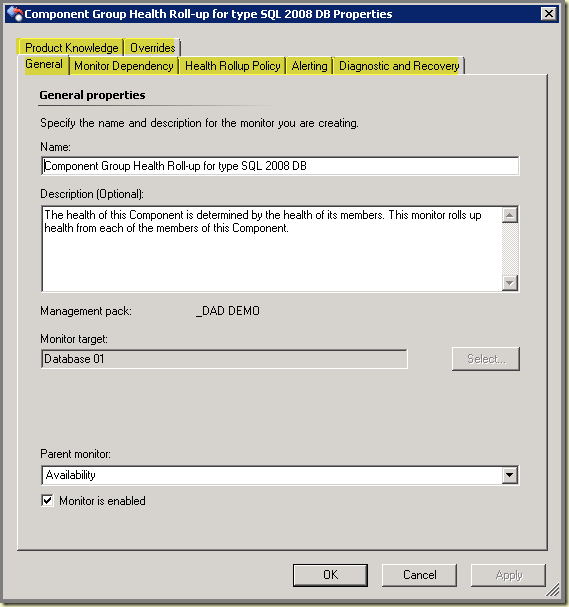
Crucial to know is that per DA Component a Dependency Monitor is created. Since this Monitor is saved to the same unsealed MP where the DA resides, this Monitor can be tweaked and tuned as needed.  
image    
image

image
All the tabs are highlighted since everything can be changed in order to fit your requirements.

This tweaking and tuning is crucial in order to get the ‘flow’ (or Health Rollup) going in some DAs. Let’s hang around the Dependency Monitor a little while longer. When taking a good look at Monitor targeted against the DA Component Database 01 one will notice that only the Parent Monitor Availability is ‘active’. The other Parent Monitors (Configuration, Performance and Security) are empty:
image

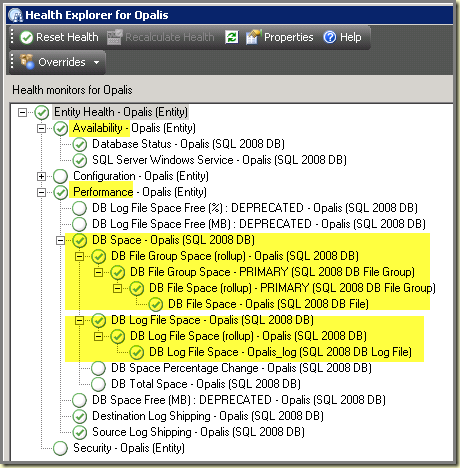
Don’t think this is because of the Object (the Opalis database), present in the DA Component Database 01, is only monitored on it’s availability. Take a look at the Health Explorer of this database:
image

As you can see, the database itself, present in the DA Component Database 01, is monitored on Performance as well. But the Dependency Monitor on that same DA Component only takes the Parent Monitor Availability into account. This is default behavior for any DA Component present in a DA. A Dependency Monitor will be created as well, ‘connected’ to Parent Monitor Availability.

Suppose the DBAs tell you they don’t give a you-know-what about the availability of the database but are far more interested in the DB space in the DB? You can change that now in the DA! Seriously!

How to use this knowledge to make your DAs better will be explained in the next posting in this series. It will be all about the Do’s, Don'ts and troubleshooting issues in DAs you might encounter. See you all next time!

Monday, June 20, 2011

Distributed Applications (DAs) – Part I: Why use them?

----------------------------------------------------------------------------------
Postings in the same series:
Part II – How about DAD?
Part III - Do’s and Don’ts
Part IV – Tips & Tricks
----------------------------------------------------------------------------------

Even though DAs can be hyped, they really have a lot of added value. But there are certain things to reckon with when using DAs. In a series of postings I will talk more about DAs and share some best practices.

But first things first. In this posting I will talk about DAs in a more general way. Later postings will be more technical.

Why should one consider using DAs?
I mean, you’re already monitoring your servers operating systems, Virtual Infrastructure, network, SQL, IIS, DNS, AD and the lot. So monitoring is already in place. Why add more like DAs for instance? Because it looks sharp? Has a nice ring to it?

No way. Because until now you’re monitoring components. A whole bunch of them. But many times business critical processes, applications and ICT environments are groups of those very same components. Wouldn’t it be nice to know when SQL server A bites the dust that Business Critical Application XYZ is still functional but when SQL Server B bites the dust it’s time for some action in order to prevent a real outage of the same application?
image

When one is monitoring components, the logic behind it all and the knowledge which SQL server is part of what business critical application or process is hard to find. If lucky at all, some people know it. But many times, they don’t. So how to translate the severity of a SCOM Alert to a level which reflect the business?

Things change dramatically when some monitored components are logically grouped/combined. Now everybody knows what components do make up a certain business critical application or process. And this is where DAs do come in and have a lot of added value.
image

Bringing SCOM to the business
At the end of the day, SCOM is facilitating Monitoring. Helping out the organization. So SCOM should go to the organization instead of the other way around. Many times ICT departments are approaching many things over the technical axis and expect end-users of SCOM to do the same. Approaches like these are doomed to fail simply because SCOM doesn’t add much value here. Only for the technical staff.

But what about Service Managers? They don’t give a sh*t whether a disk is full or not. Whether SQL dies or not. They want to know the status of ‘their’ services, are they still available and functional? With a single glance on a screen without the requirement to cycle through all kinds of Views.

So SCOM has to facilitate that in order Service Managers do get the kind of information they really need. This way SCOM will hit a different layer in the organization, outside the technical areas.

Which is good, since many times the decisions for the budgets are made here, not on the technical level. So when the (Service) Managers are aware of the added value of SCOM changes are that budgets will be available for it as well. Whether you’re talking money or resources, both are really needed in order to get SCOM to the next level and keep it there…

Are DAs magic?
No, they aren’t and sometimes outright a bit buggy. But when one knows these potential pitfalls and how to address them, DAs can be shaped to your will, or better, requirements of your organization.
image

Even better, DAs aren’t the last station. When one builds DAs in a smart kind of way, the components of the DA or the DA itself can be reused in Dashboards so the way DAs are displayed is totally up to you, thus removing the Diagram View limit in the SCOM Console. For more about Dashboards, check this series out.

How to go from here?
Easy! Just follow my blog and soon new postings in this series will come out, all about building DAs and how to use them to their fullest extend. So stay tuned and start building DAs!

Goodbye Opalis, hello Orchestrator 2012

A couple of days ago Microsoft released the first public beta of System Center Orchestrator 2012, SCO12.

All you need to know is to be found here.

Other sources
Fellow MVP and friend Graham Davies posted about a SCO12 installation error, the cause and how to solve it. Christopher Keyaert posted a detailed step-by-step installation guide for SCO12.

Picture taken from the blog posting made by Christopher Keyaert.

Friday, June 10, 2011

Cluster MP: One or more Clusters not monitored and how to solve it

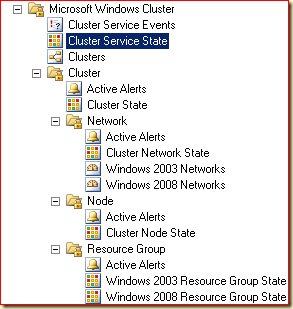
Sometimes ones bumps into the issue where one or more Clusters (Microsoft Windows Cluster > Cluster > Cluster State) aren’t monitored. Even when the whole MP Guide has been read, understood and applied, the state doesn’t change.

How to solve it
First of all, make sure all prereqs are met as outlined in the related MP guide. Check and double check. If so, and some Clusters are still not monitored, it’s time for a small kick in the b*tt of the Discovery processes.

One doesn’t have to take a deep dive in order to do that. The creators of the Cluster MP provided a Task to do just that.

  1. In the Monitoring Pane go to Microsoft Windows Cluster > Cluster Service State and select in the middle pane the Cluster Node of the problematic Cluster.
    image

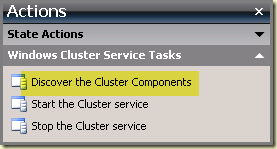
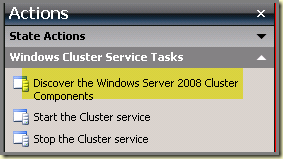
  2. In the Task Pane the Cluster Node related Tasks will be displayed:
    For Windows Server 2003 based Cluster Nodes:
    image 

    For Windows 2008 Server based Cluster Nodes:
    image 

    Click on the Task Discover the Cluster Components or Discover the Windows Server 2008 Cluster Components. The Run Task screen will be shown now. Use the correct credentials and hit the Run button.

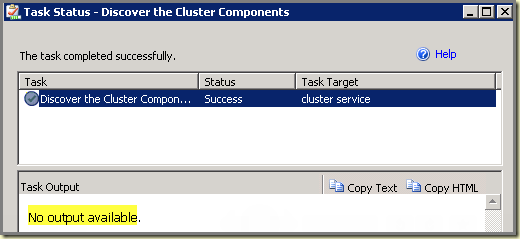
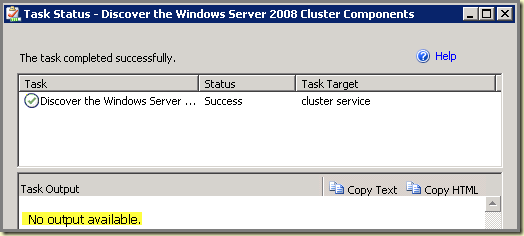
  3. When the Task is finished the message No Output Available will be shown, which is OK.
    For Windows Server 2003 based Cluster Nodes:
    image 


    For Windows 2008 Server based Cluster Nodes:
    image

  4. Wait a while and soon the Clusters which weren’t Monitored, will show up as Monitored. And later all the related Cluster components will be discovered as well and monitored.

So whenever a Cluster isn’t monitored, follow this procedure and it will most probably help you out. 

Thursday, June 9, 2011

SCOM Notifications Not Working:

Notifications in SCOM can be a great thing to work with. However, when some or more Subscriptions don’t work as intended, it can be a challenge to solve it. I have blogged about some issues one can bump into, found here.

New issue
Recently I bumped into an issue where some Subscriptions didn’t work. Out of six subscriptions, 3 didn’t send out anything while they were using the same Notification Channel and Subscribers. So something else was at play here, with the Subscriptions themselves.

Time to investigate
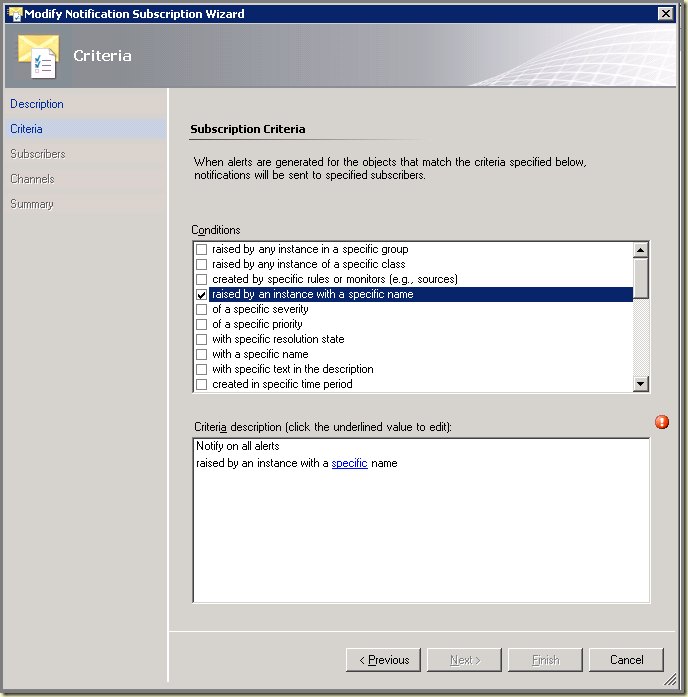
When I ran a comparison I found out that the functional Subscriptions were targeted against Groups (among other Criteria) and the non-functional ones targeted against an instance with a specific name (raised by an instance with a specific name). And for two of those Subscriptions, many servers were added to it.
image

Time for a test
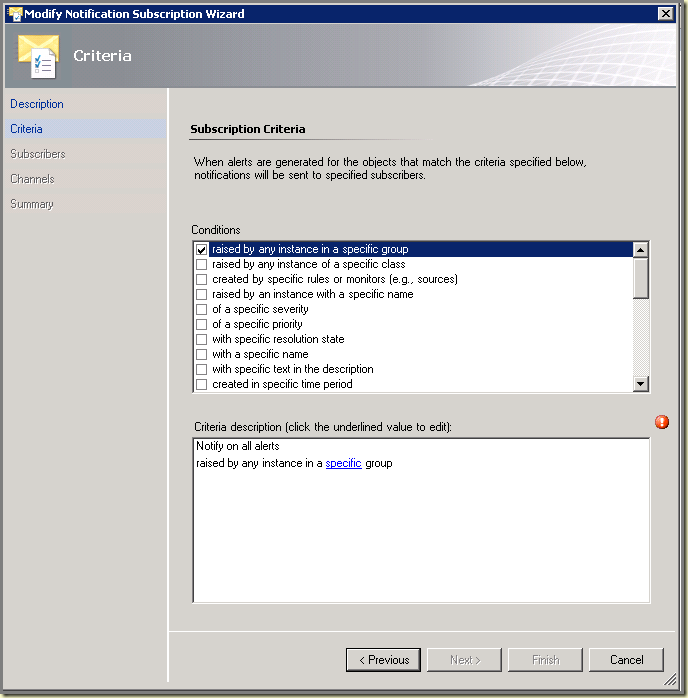
I copied the server names, put them in a custom Group and retargeted the Subscriptions. Instead of using the Criteria ‘raised by an instance with a specific name’, I used the new Group. Saved the Changes and waited. Soon some Alerts were raised which related to the Subscriptions and within a minute the first Subscriptions were sent! Nice!
image

I changed the other Subscriptions as well to use Groups instead of the instance with a specific name, and all works just fine now. In order to get Alerts as well when the servers aren’t operational as well, I added per server the related Health Service Watcher (Agent) object as well.

So whenever using Subscriptions and some aren’t working, check out the Criteria. Sometimes the cause issues.

HP EVA Performance MP: Version 3 is out!

Alexey Zhuravlev has created an improved version of the HP EVA Performance MP. Versions 1 and 2 were created by Alain Côté.

The latest version of the MP contains these improvements:

  • Scripts are composed in a shared data sources to support ‘cookdown’;
  • New classes for better targeting and granularity;
  • Most of the collection rules have a short knowledge articles;
  • Added the Unit Monitor that checks for friendly names config file existence and generates an alert (including a knowledge base article);
  • Minor scripts improvements. New scripts a little bit more stable and should not fail if you do not have an optional components (like a data replication groups) on your EVA;
  • New views;
  • Collection Rules for Windows PerfMon Counters are added (this rules are disabled by default);
  • Diagnostic task for Disk Group - Average Write Latency Monitor shows a TOP 5 virtual disks for Write Latency (not for activity, we're found that top 5 active (in+out MB\s) disks don’t help us to troubleshoot, just because our biggest virtual disks are always on top, not the slowest disks which are the 'latency generators');
  • New reports (defined in the dedicated management pack).

To be found here. Free registration required for download.

AEM: ADMX File for SCOM R2

With Windows Server 2008 a new Group Policy format for displaying registry-based policy settings has been introduced: XML file format known as ADMX files. When one wants to use Agentless Exception Monitoring (AEM) in SCOM, one needs to create a GPO template. Until now this template was based on the old format, ADM.

In Windows 2008 environments this approach works well. But what if the new format, ADMX files, is the only one allowed? For now there wasn’t a way to get around it.

Until now that is. Microsoft has released an ADMX file for SCOM R2 AEM, to be found here.

Wednesday, June 8, 2011

Digging through log files? SMS Trace is the way to go!

Sometimes troubleshooting is required. This involves digging into all kinds of log files. When a log file isn’t too big, Notepad will do the trick. But when a log file is some MBs in size, Notepad isn’t good anymore. Why?

Two main reasons:

  1. When the log file is opened in Notepad new entries – written to the log file after it has been opened – won’t be shown. Notepad must be closed and the log file reopened, again and again…;
  2. Notepad displays text and no colors. So one has to look for errors him-/herself. Changes are that some crucial information is overlooked.

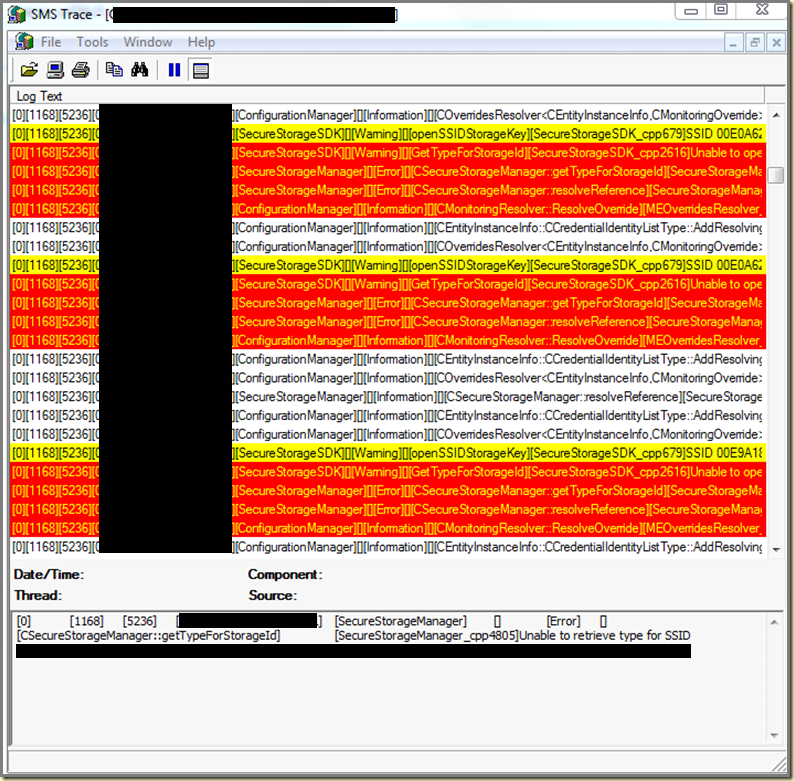
So how to go about it? Good news! There is a tool – for free – which elevates both mentioned issues. When opened the log file will be refreshed and warnings and errors are automatically color coded: yellow for warnings, red for errors.

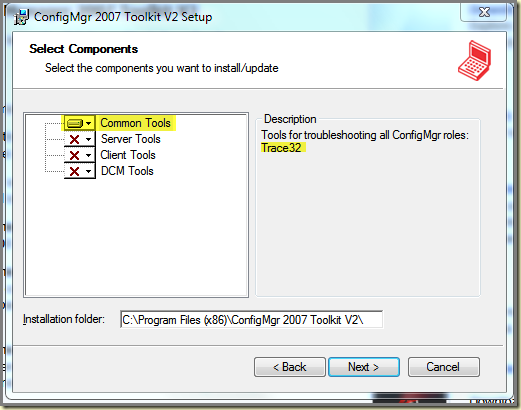
This tool – SMS Trace - is part of the System Center Configuration Manager 2007 Toolkit V2 and can be downloaded from here. Install the tool (completely or only the part containing SMS Trace) and be happy.
image

Now the log file looks like this:
image

Monday, June 6, 2011

OpsMgr 2012 Community Evaluation Program (CEP)

Wow! I am already test-driving the newest version/edition of SCOM R2: OperationsManager 2012 (OM12). And it rocks! Big time! Much of it is NDA so I am not allowed to blog about it. One day that will change however.
image  

For now companies can sign up for the OpsMgr 2012 Community Evaluation Program (CEP), enabling organizations to learn more about OM12 and assist in shaping it! Want to know more? Go here.

SCOM R2 Resource Kit available for download

A few days ago Microsoft released the SCOM R2 Resource Kit which includes 3 tools:
  1. Scheduled Maintenance Mode - Ability to schedule and manage maintenance mode in the management group.
  2. Clean Mom - Helps remove all installed R2 components.
  3. MP Event Analyzer - MP Event Analyzer tool is designed to help a user with functional and exploratory testing and debugging of event based management pack workflows like rules and monitors

Want to know more? Go here.

Wednesday, June 1, 2011

Logical Disk Fragmentation Level Monitor: Creating Noise outside SCOM…

The Monitor ‘Logical Disk Fragmentation Level’, introduced in the latest versions of the Server OS MP, creates a lot of ‘noise’ not only limited to the Console.

I know, the Monitor runs once a week (every Saturday at 3 AM) so when there is no policy or agreement in place about fragmentation, the SCOM Console will raise a few up to many Alerts in the Console. But that’s only the starting point of the noise, since a discussion will soon follow which will supersede the amount of Alerts – created by the earlier mentioned Monitor – about whether or not to defrag the logical disks on which SCOM raised these Alerts.

But why? In order to get to the bottom of this let’s take a few steps back.

Past, Present & Future
In the past there was a world where server virtualization was something you heard of or even tested it, but didn’t use it at all or on a reasonable scale in production environments. Much has changed. Today all of the customers I work for do run one or more virtualized infrastructures. Whenever a server is provisioned, it’s a virtual one. Sometimes a physical box is required and provisioned, but it isn’t the standard anymore.

In the old world, disk fragmentation was also at play. And – under most circumstances – easily addressed. Just run a defrag tool and be done with it. Of course, in some SAN configurations there were other approaches required, but in 80% of the defrag demand, a local tool would do the trick.

Along came a virtualized server
But how to go about defragmentation on virtualized servers? There are many new ‘ingredients’ to reckon with when SCOM raises an Alert about a ‘logical disk’ in a VM which needs to be defragmented. Because the logical disk is also virtual, hosted by the Virtual Infrastructure. So where does one need to run the defragmentation tool/command? On the VM level, no matter what? On the host level? (But what host is running the VM at that moment?) On SAN level? And when we’re talking SAN, are we talking about LUNs? Or the ‘whole’ SAN? Also, what kind of disk are we talking about? A fixed or dynamic one? Are they present on a cluster shared volume or not? Are we talking Hyper-V or VMware? Are there snapshots of that VM present or not?
Auslogics Disk Defrag 3.2.1.10 rus

The discussion has started
As you can see, the decision whether to defrag or not isn’t a simple one. Even when it’s decided to do so, at what level and where do you run it? In today’s world it isn’t up to the systems engineers anymore. More knowledge about the Virtual Infrastructure, storage and SAN is required. So the colleagues responsible for those area’s must be taken into the loop as well.

And the winner is…
Unfortunately there isn’t a default answer available. Simply because there are too many variables at play which not only differ per company but also per environment (Production vs Test for instance). And when looking for an answer on the internet there are good and solid postings to be found which contradict each other…

So what to do?
Whenever I bump into a situation like this – believe me I have been there a few times – I let the company decide and provide them these basic guidelines:

  • Take the colleague's responsible for the VI and storage/SAN from the beginning in the loop, when everybody is still blank and all options are open (this way they know their opinion really matters);
  • Set a time span for an outcome, like two to three days (otherwise nothing will happen);
  • During that time, disable the Monitor temporarily (reduces the noise in SCOM);
  • Write down the pro’s and cons for every option when running the defrag tool/command on every level (VM, host, SAN etc);
  • Write down the pitfalls (for example: defragging causes high IO which is bad for other VMs, when a snapshot is in place defragging is a no go area…);
  • Write down the decision and the reasons why;
  • Write a test plan, targeted at a limited set of servers, test it and monitor the impact on the VI, Hosts, VMs and SAN;
  • Process the results, adjust if needed – test it again! – and when all is well, put it into production by batches;
  • Adjust the monitor as required.

It may sound stupid to go through such a scenario but it’s the only way to get it right. Otherwise you might find yourself in a situation where your VI and SAN are hammered down by defragmentation actions…

Some helpful internet url’s in order to create more uncertainty about whether or not to defragment a logical disk of a VM:

  1. http://itknowledgeexchange.techtarget.com/virtualization-pro/defragmenting-virtual-machine-disk-files/
  2. http://www.brianmadden.com/blogs/rubenspruijt/archive/2010/11/29/vdi-and-storage-deep-impact.aspx

Another piece of advise:
The Monitor contains a Recovery Task for automatically defragmenting the logical disk. This Task is disabled by default. Don’t enable that since you’re out of control and SCOM will kick of the defrag command without any clue about the earlier mentioned questions and their answers. So stay away from it and stay in charge of your own environment.