Taken directly from the website: 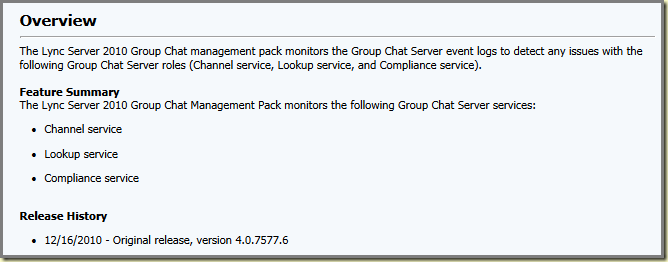
MP to be downloaded from here.
Taken directly from the website: 
MP to be downloaded from here.
The Azure MP makes no difference here. And not just that, the guide needed a bit extra attention as well in order to get the monitoring of your Windows Azure based applications correct.
Microsoft has acknowledged that and has published a new version of the guide related to that MP. On top of it all, Brian Wren has written about this MP in more detail.
Hope this helps, since a much respected colleague of mine needed some time to get it all running. And he really knows his stuff.
Actually it is a much welcomed feature which has been added to SCOM R2 with CU#3. So a Cumulative Update for SCOM R2 does contain a lot more than ‘just’ some hotfixes for SCOM R2. Nice!
What the Parameter Replacement in Web Applications does? (Taken directly from Brian Wren's blog)
‘…it allows you to pick up a piece of information from the body of one request and then use it to replace a parameter in other requests in a web application…’
Why?
‘… there were applications that you really couldn’t monitor because they require data in their query strings that are dynamically created. You have no way of knowing what their value is going to be until the first request runs. Since the Web Application template had no way of doing that, you were left writing a custom script. Now you can record or manually create the web application and then modify the requests to perform exactly this functionality…’
OK. Now I understand. But how do I use it? Is there anywhere a sample to be found along with more details?
Yes, there is, go here and read all about it. 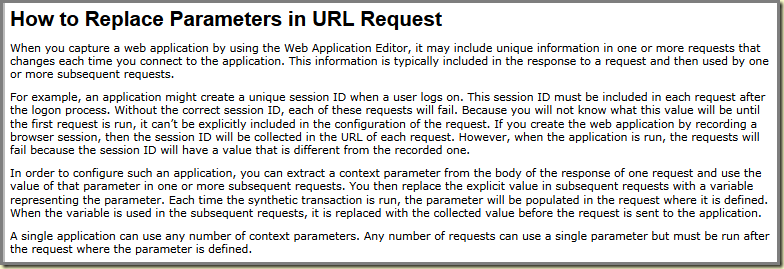

Therefore I wish all the visitors of my blog a Merry Christmas & a Happy New Year.
Good information for anyone who wants to know the nuts and bolts of the SCOM security model. Also good to understand since it is visualized, like this: 
But how many Consoles (UI or Web) and PS with the SCOM extensions can one run simultaneously before the RMS is starting to sweat?
Good question! In order to answer that we have to take a look first at what number Microsoft supports. This website tells one how much load a single Management Group (MG) can take, also how many simultaneous Operation consoles: 
Wow! So my MG can take that all? Nice! But wait just a minute here. This number is not only the maximum as supported by Microsoft, it also based on the best practices on how to configure your MG. So when you run a MG based on a single-server solution (SQL and RMS run on the same server and all Agents report to that server) - only to be advised in lab environments - it is very likely (duh!) that the number of simultaneous running SDK connections is far less.
Also how much load the RMS takes has to be taken into account. Is it a virtual or physical server? Is it a dedicated server (I do hope so)? Does the RMS also have Agents reporting to it or is the RMS purely dedicated to the MG? And how is the environment tuned? Are all MPs imported without RTFM? Or are only the required MPs imported AND properly configured? Also, is the MG up-to-specs? Are the latest SP/CUs/MPs in place?
As you can see, it is not easy to tell how many simultaneous Operation consoles your MG can take before it begins to sweat. When you know your environment, it is basically YOU who knows best.
But think about this situation: YOU know how many simultaneous Operation consoles your RMS can take. So you have instructed your team about it. But wouldn’t it be nice to be alerted in advance before that number is exceeded? So there is time available to act?
I know. There is a Performance View which shows just that. 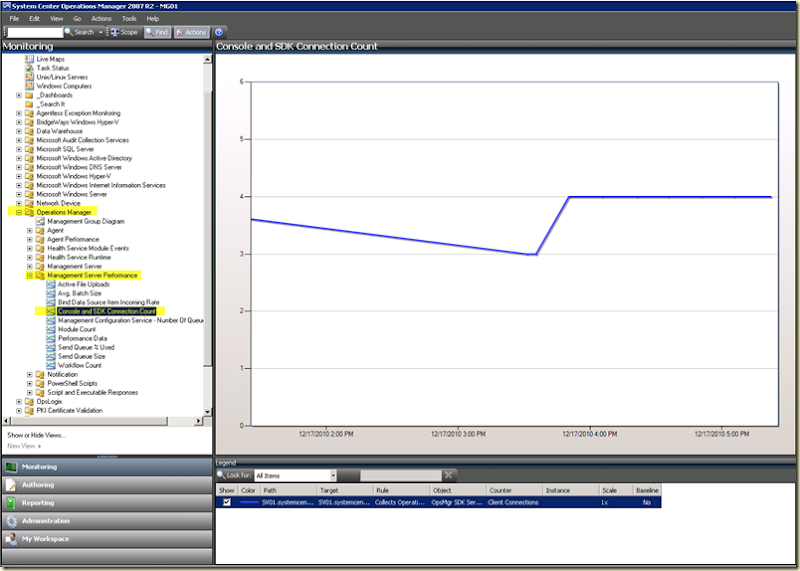
But looking at it all day isn’t a job one is waiting for, is it? So it’s time for another approach. This posting will show you how to build such a Monitor, directly from the SCOM R2 Console itself. So you get Alerts like these: 
(Please, don’t comment on the other Alerts, since this is just one of the many test environments I run :) )
No fancy MP Authoring required here. Almost Next > Next > Finish :). So let’s start!
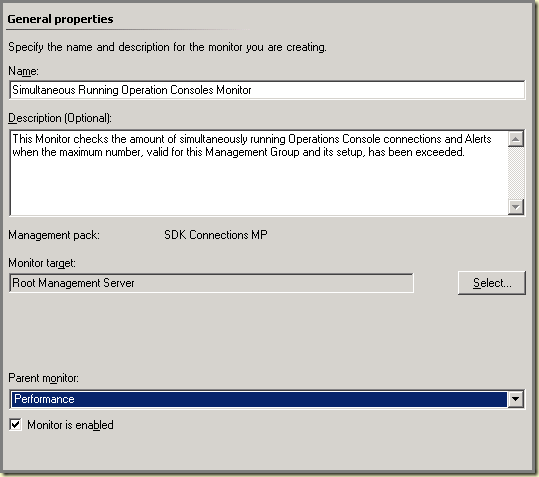
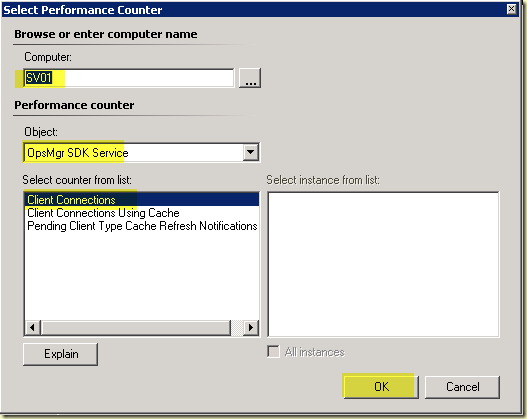
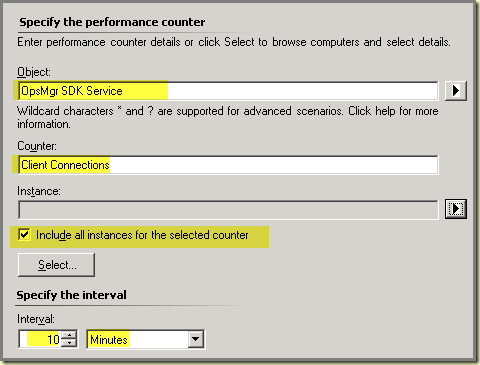
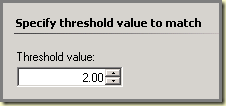

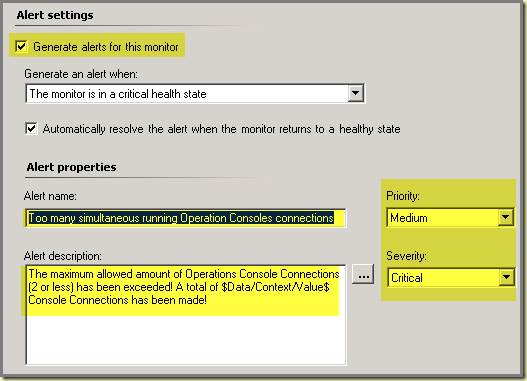
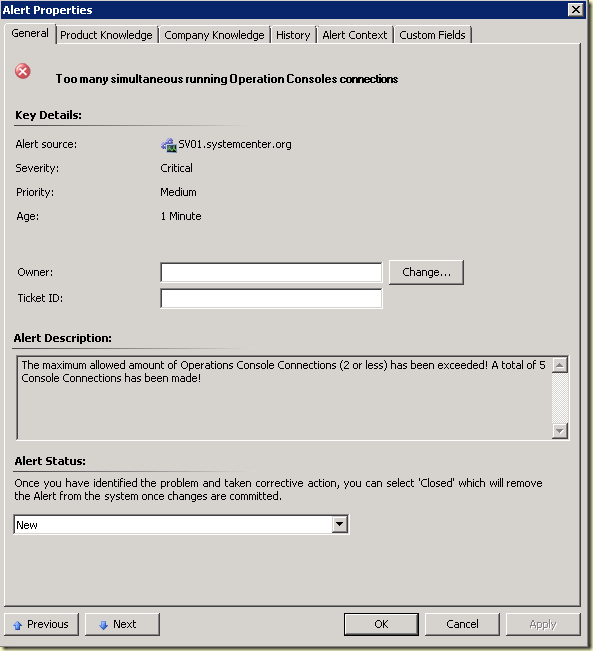
So now SCOM will Alert you in time! Nice isn’t it?
Reminder:
Normally there are always a few SDK connections active, like the SDK Service running on the RMS itself. So when a number of five is shown, it does not mean there are FIVE Operations Consoles running…
The OpsMgr Support Team Blog posted a solution when an exception is thrown while importing the Red Hat Linux Management Pack (taken directly from their website):
| Before deploying the agents you need to import the respective Red Hat Linux Management Pack but when you attempt to do this the process fails with an exception upon import: An exception was thrown while processing ImportManagementPack for session id uuid:eff4da8a-fd0f-4607-9c63-5300f4733ee0;id=2. Full exception detail: Could not load ManagementPack [ID=Microsoft.SystemCenter.WSManagement.Library, Keytoken=31bf3856ad364e35, Version=6.1.7221.30]. |
Cause and resolution are found here.
Taken directly from the website: 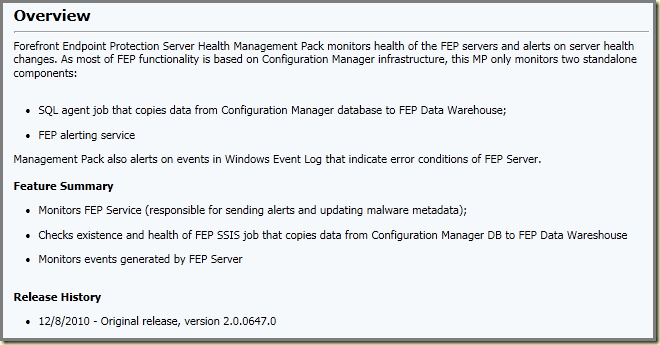
MP to be downloaded from here.
Taken directly from his blog (and edited a bit):
Have you ever been troubleshooting a problem with remote SQL (proxy MP, remote DB, etc) and wanted to test to see if the local system account (or any account for that matter) could make a remote connection to SQL but you didn’t want to install the SQL tools just to make that test? Seems there is a file type – UDL file – that you can simply create that will bring up a window to allow testing of remote connections to SQL.
The program allows some tweaking as well, see the tab Provider: 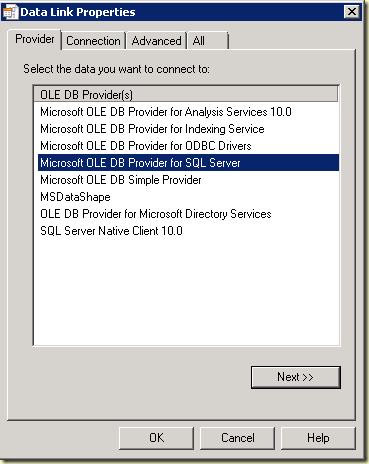
The second tab Connection is where it all happens: 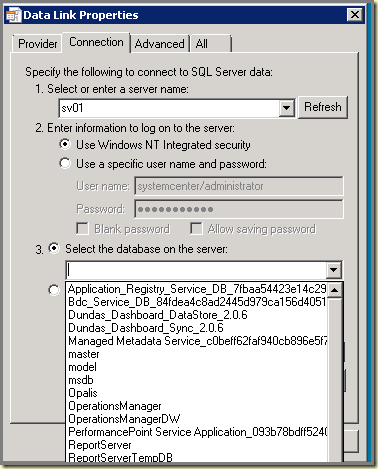
Thanks Steve for sharing! Much appreciated!
But those days are over! Microsoft has published good information about that and other SCOM R2 custom reporting as well:
Want to know more? Go here.
No more crappy MPs from Dell. Nice! This posting is about the MP, what’s new and what’s changed. So let’s start.
Package:
Stupid to mention perhaps, but don’t forget to unblock the downloaded executable file when you are running Vista, W7 or W2K08. Otherwise you might end up with strange errors while trying to unpack the file :). 
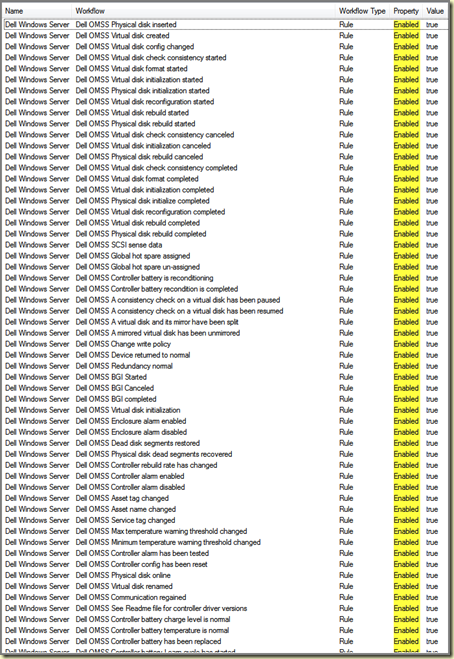
The package contains 11 files all together: four of them are text files and seven of them are MPs. Compared to the previous version an extra MP (sorry, Dell refers to it as a utility) has been added. Unfortunately, the pdf file (present in the previous version of the MP) has been removed and replaced by text files instead. Good for the information these files contain, bad for the level of readability.
The four MPs are:
The three utilities are:
The dependencies between the MPs and Utilities are depicted below: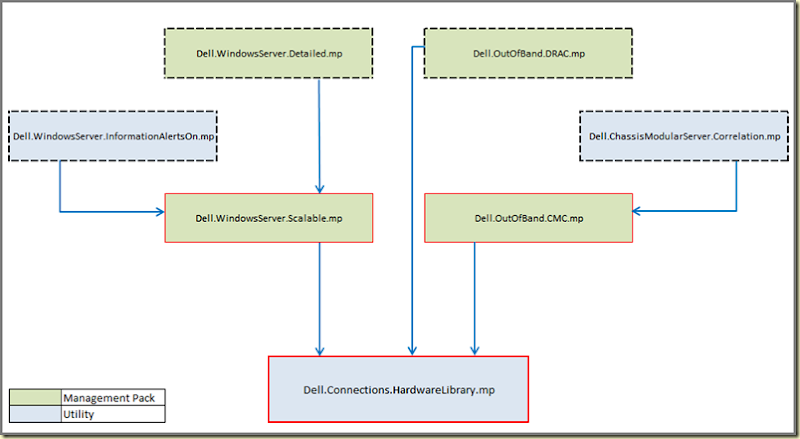
(Thick red line: Primary Base MP, thin red line: Secondary Base MP, broken black line: non-base MPs.)
Requirements – Dell servers:
(All these requirements are found in the text file ‘DellMPv41_Server_Readme.txt’)
Requirements – OpsMgr Servers: (Only needed when running certain Dell Tasks from the OpsMgr Console)
Support – Dell systems:
Support – Windows Server OS:
Wh00t! Windows 2008 R2 is now officially supported.
Required authorizations:
Mostly the default authorizations will suffice. For these two options Power User or Administrator permissions are needed:
Some advice:


Wrap up:
Since I haven’t tested the MP yet, its too early to make any real statement. However, the set of MPs looks promising, just like the previous version. Already I got some feedback stating that the Discovery issues has been solved indeed.
The approach where the MP is broken down into a set of components is a choice which I still highly appreciate. One can choose what to MPs to load and configure and what MPs to skip. So its good to see that Dell is still committed to this approach, introduced with the previous version.
The new MP (Dell Chassis Blade Correlation utility) adds additional functionality to the MP and monitoring of Dell hardware as a whole. Again, one can choose to add this MP or leave it.
Please let me know about your experiences. When you’re OK with it I will put them on my blog, referring to its source (of course).
Besides a fix for the Discovery issue(!) it contains these improvements:
MP can be downloaded from here. 
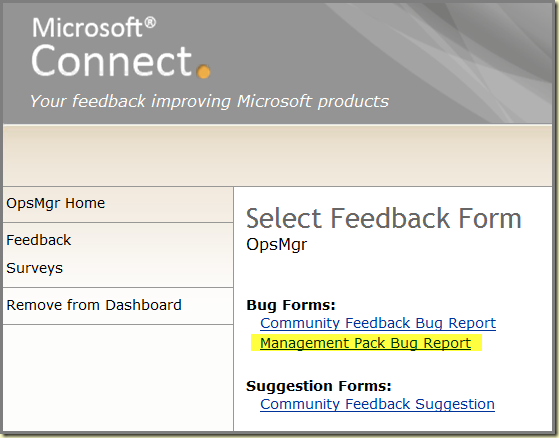
So Microsoft is not only upgrading the infrastructure of SCOM (OpsMgr vNext) but is also working on the MPs themselves. In order to do that, input from YOU is needed. So let’s help making the ‘blood’ of SCOM better!
Go here, log on and let them know what you think about the MPs.
I can tell you that Microsoft listens and cares.

Go here to watch the video.
What this MP does? Exactly what the name of the MP implies: it enables one (a SCOM Operator for instance) to forward an Alert shown in the Console via Email: 
The MP uses Outlook and when that’s not available it will use SMTP instead.
MP to be found on System Center Central. One needs to subscribe (for free) in order to download the MP.
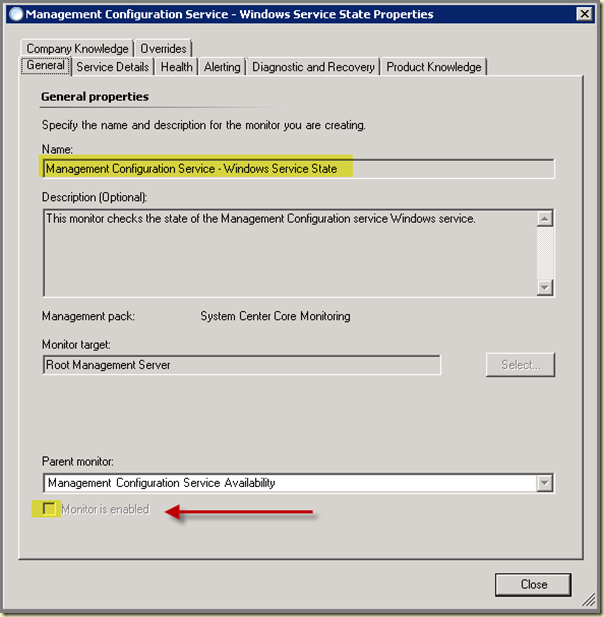
However, this service is very important for the SCOM R2 Management Group as a whole. So it is better to override this Monitor (Enabled > True) in order to enable it. And don’t forget to store this override in a MP of its own.
I have read the guide related to this MP but I haven’t found anything why this has been done.
Another thing one can choose for is to enable a Recovery action for this monitor. By default it is not enabled. Open the Overrides tab for this Monitor, select the option Recovery > Start Management Configuration Service. Click the button Overrides > For all objects of Class: Root Management Server > and set Enabled to True, don’t forget to store this override in a MP of its own. 
Why?
For one thing, it does not monitor the individual printers. Secondly, it’s a converted MOM 2005 MP. When SCOM 2007 just hit RTM many MPs were like that. But hey, we are now at the end of 2010 and therefore I do not see any reason why this particular MP is still a converted one. In order to unleash the real power of SCOM a MP requires to be fully native. The ‘latest’ version comes from the 25th of August 2008… 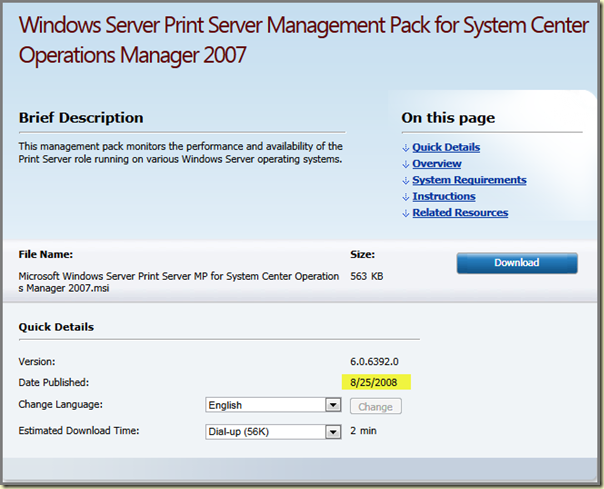
So this MP lacks much functionality like for instance monitoring Print Servers based on Windows Server 2008 R2. Gladly Kevin Holman has solved it by writing (and sharing) an addendum MP, which discovers those instances and monitors them as well. Addendum MP to be found here.
Another thing which this MP misses out on is the monitoring of individual printers. Gladly Steve Rachui has written a MP which does just that. This MP doesn’t really need the Printer Server MP. The MP Steve has made shows this View in the SCOM Console: 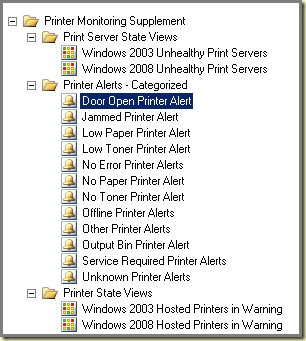
This is really more like it! Because it is a native SCOM MP, its built in 2010 AND it monitors individual printers! Wh00t!
MP to be downloaded from here.
Thanks Steve for your efforts AND sharing it! Much appreciated.
One thing keeps on nagging me in the back of my mind: When does the Print Server Team pick up the efforts from Steve and Kevin, ditch the old MP and bring out a NEW NATIVE MP? But perhaps I am asking too much now….
Charles Joy (Opalis Evangelist) has recently presented a session for today’s CTSMUG monthly meeting. During that session he talked about Opalis, what it is and what it does.
The strength of his session is that it is has different focuses: Sales/Marketing and Technical: 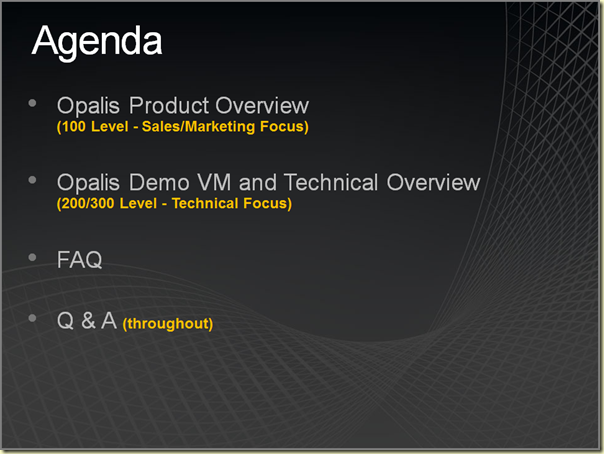
The slide deck he used is to be found on his blog in conjunction with two video’s. For any one asking him/her self what’s Opalis all about, this is a GREAT starting point.
Thanks Charles for sharing!
He is the one who created those Stencils and has updated them. Now these stencils contain TWICE as much icons! Wow! Some screen dumps:
And that’s not all! No way! He has a collection of Visio Stencils which are very handy and a MUST have for any one who needs to design an IT environment. These are the free downloadable Visio Stencils Jonathon Cusson offers on his website: 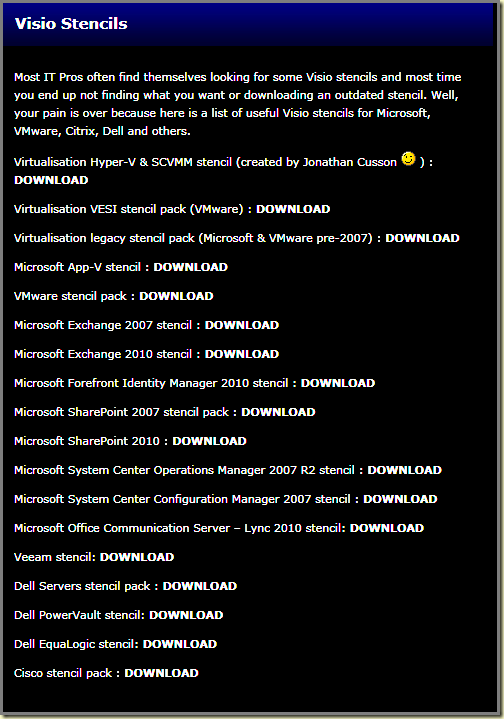
Go here and get them!!!
All credits go to Jonathon Cusson. Thank you for your time, efforts and sharing! A job well done!
In the fourth and last posting of this series I will describe another new feature in OpsMgr vNext, the Topology Simplification. On top of it all the timeline, set for this newest version of OpsMgr will be shown alongside a total wrap up of the total session presented at Tech-Ed.
Lets start!
Topology Simplification
In one of mine blog postings I compared the today’s hierarchy of SCOM (SP1/R2) with NT4:
‘…One can look upon the OpsMgr hierarchy as Windows NT4. Here one had a Primary Domain Controller (PDC) with a writable SAM and one or more Backup Domain Controllers (BDCs) with a read-only copy of the SAM. And no matter from what location the User Manager or Server Manager was being run, it always connected to the PDC since that server contained the only writable SAM. Any adjustment was done there and then replicated to the BDCs. The RMS is just the PDC of OpsMgr and the Management Servers are the BDCs. So the RMS maintains the OpsMgr Management Group in every kind of way. Importing MPs? Done there. Adjusting MPs? Done there. (Web) Console connections? Authorizations? Notifications? Setting permissions? Scoping Views? Deleting objects? Setting Overrides? Yep! The RMS does it all. All changes are being put into the OpsMgr related DBs and replicated to the Management Servers…’.
Well, the NT4 days are history, so it’s time to throw out the RMS! Why? Because it is a SPoF (Single Point of Failure). Say what? The RMS can be clustered? Yes, you are right. But personally I don’t like that kind of setup since it is prone to errors, especially when an update like a CU has to be applied. And when a clustered RMS breaks down, it can take a lot of time and energy to get it right again.
Microsoft got much response from their customers and MVPs about the RMS and its SPoF ‘capabilities’. And again, they LISTENED!
With OpsMgr vNext the RMS won’t be there anymore. All OpsMgr vNext Management Servers will be running the SDK and Config service, alongside the Health Service! Also an additional database has been added: the Config DB, which is OPTIONAL and advised to be used in REALLY LARGE OpsMgr vNext environments with a huge config space!
How does OpsMgr vNext function without the RMS? Lets take a look at these pictures:
Picture 01-A:
As you can see, all OpsMgr vNext servers are connected to all three OpsMgr related DBs. On all three Management Servers the three OpsMgr services are running. And every single Management Server has a certain set of managed (monitored) items ‘talking’ to it: the MS on the left has a Gateway Server talking to it, the MS in the middle manages a set of servers and the MS on the right monitors network devices and Windows Azure.
So that’s good news: load distribution, however nothing new compared to today’s situation with OpsMgr.
But wait just a minute! Suppose the MS in the middle dies. Now what? The servers reporting to that MS aren’t monitored anymore? That’s bad! With OpsMgr as it is today we had a single SPoF and with OpsMgr vNext we have multiple SPoFs? 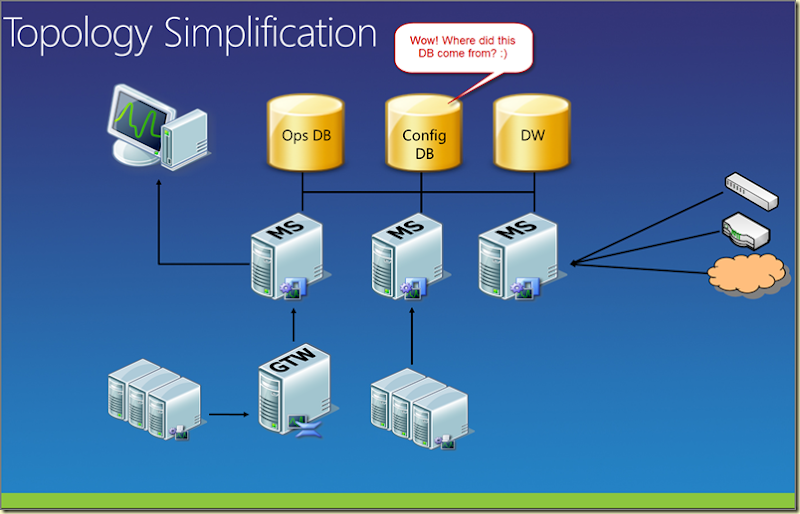
Gladly Microsoft thought this one over and introduced a new concept in OpsMgr vNext in order to address that issue: an OpsMgr vNext Server Pool. Without it one would experience the above mentioned issue where a single instance of a Health Service run by an OpsMgr Management Server monitors a set of devices, and when that Management Server dies, so does the monitoring of those devices.
Picture 01-B:
But take a look at this picture where a POOL is being used. A Pool is nothing more of a logical grouping of multiple Health Service instances. So instead of a set of monitored devices being managed by a single instance of a Health Service, running on a single Management Server, these devices are being managed by a set of multiple Health Services, hosted by multiple Management Servers: 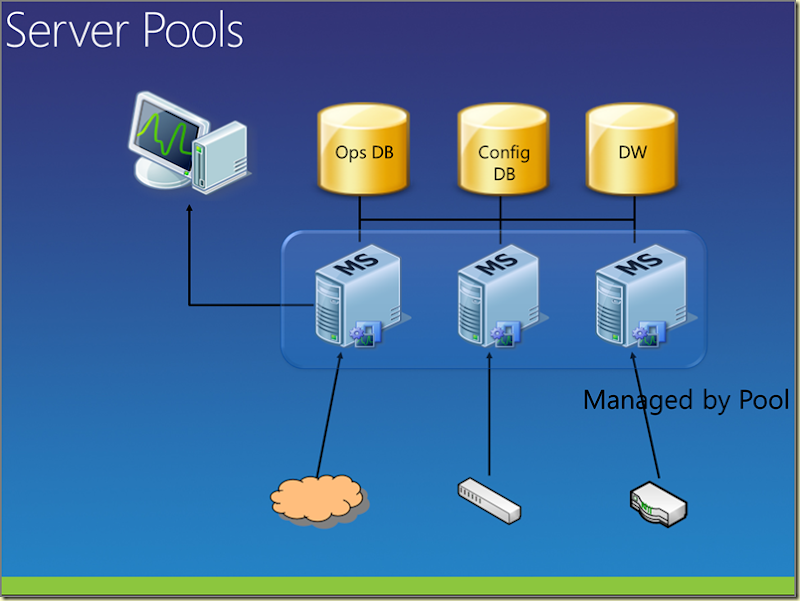
Picture 01-C:
And when the Management Server on the left dies, the other Health Services in the Pool will automatically take over the devices which were being managed by that broken Management Server! Wow! Sweet! 
And these Pools aren’t limited to MS only! No way. One can also create Pools for Agents. Why should one do that? Imagine you use certain monitored servers as Proxies for OpsMgr vNext in order to monitor Windows Azure or a set of websites. When the server hosting that OpsMgr vNext Agent dies, the additional monitoring being run by that same server (as a Proxy) would come to an end as well.
When using a set of Agents in a Pool, that would not happen and monitoring of those Azure based apps and websites would be taken over by one or more Agents in that same pool!
So the SPoFs are really gone in OpsMgr vNext! That’s really a HUGE improvement!
Java EE (J2E) Web Service Monitoring:
Like WebSphere/WebLogic/JBOSS/Tomcat on Windows. In telegram style: Investments made on .NET side are also made on J2E server side. Demonstration about the first beta version was given. The way it is presented in the OpsMgr vNext Consoles is the same across all monitored objects in OpsMgr vNext. Same user experience like monitoring other applications and services. Nice!
Partners:
Many third parties write MPs for OpsMgr. However with OpsMgr as it is today, it is a challenge for them to get a real native MP which means the MP is fully integrated into OpsMgr without the need for additional layers of software, installed alongside or even separate servers. 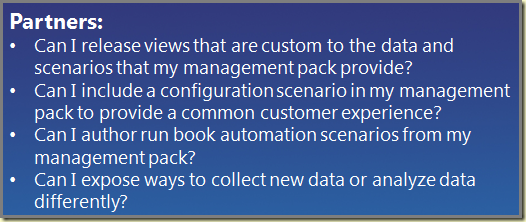
With OpsMgr vNext Microsoft addresses this issue so Partners are enabled to author native MPs by providing a standard, simple, reliable and consistent way to build their rich solutions on top of OpsMgr vNext. 
Timeline:
When can we expect OpsMgr vNext to go RTM? Q4 2011: 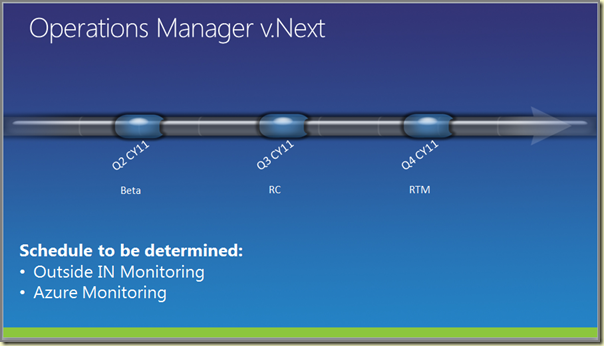
Total Wrap Up:
Wow! OpsMgr vNext is really something new. Not just a rebranding of the name has been done. No way! OpsMgr vNext has much to offer, compared to today’s version of OpsMgr (R2 with CU#3). Many things have been altered, adjusted, improved, added and enriched.
Sometimes I get questions out of the field about the upgrade path to OpsMgr vNext or that it is going to be the same like the move from MOM 2005 to SCOM 2007. In that scenario an upgrade wasn’t possible. One had to install SCOM 2007 alongside MOM 2005.
Good news is that OpsMgr vNext allows for an upgrade path from OpsMgr R2 CU#3 to OpsMgr vNext. As Microsoft puts it: ‘It will be a Seamless Experience’. Also custom made MPs will migrate from OpsMgr R2 CU3 to OpsMgr vNext. Only small scenario's based on PS and SDK will not work right away, because of some DB Schema updates, but MPs and DA's should just work. When it doesn't Microsoft wants to know!!!
So OpsMgr vNext has much to offer, like:
Personally I think this list will only grow in the months to come. In Q2 of 2011 the first public beta will be available, from that moment on we can see what additional features have been added as well.
For now Microsoft has shown its dedication to the OpsMgr product. Many things have been added, improved and enhanced. Much of it based on the input from YOU!
So whenever you bump into an issue with today’s version of SCOM do not hesitate and post it on Connect. Microsoft listens and cares! Only with the input from its end-users Microsoft is capable to develop the next generation of a product which really adds value.
Until last week that is. I bumped into a GW that wouldn’t work. AT ALL! I could reproduce it as well with another GW, installed in total different environment. Strangest thing was that another SCOM R2 GW server was already installed and fully functional. So what was happening? And more over, how to solve it?
The Situation:
The SCOM R2 GW is installed and everything is in place (certs, SCOM GW Approval Tool has been run, firewalls have been configured and the lot). So there is a connection from the GW to the MG.
However, the GW throws EventID 20070 with the message ‘…Check the event log on the server for the presence of 20000 events, indicating that the agents which are not approved are attempting to connect ’: 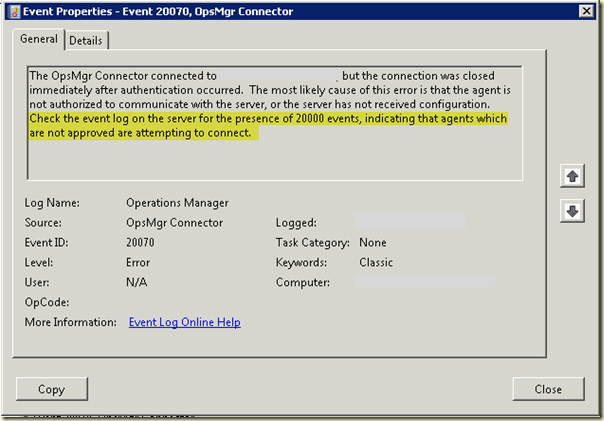
On the RMS side of things, EventID 20000 is shown, telling that the SCOM R2 GW tries to connect but isn’t recognized as part of this Management Group (…A device which is not part of this management group has attempted to access this Health Service. Requesting Device Name : <GW SERVER NAME>…): 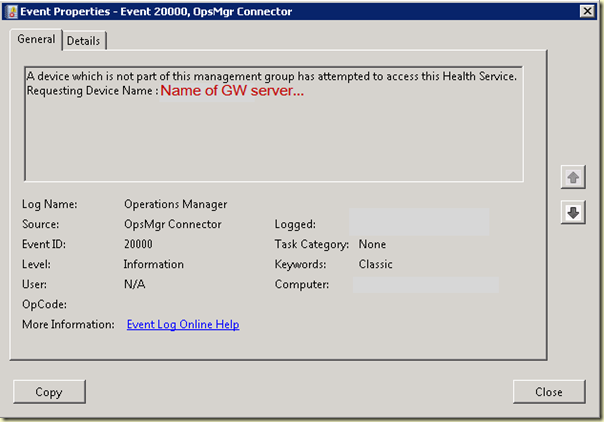
Things we tried:
Wow! We did many things in order to get it all up & running:
All to no avail. Nothing solid came out of it.
So I installed a new SCOM GW in total different Forest. And experienced the same issue! And all that time, the GW server which was installed some weeks ago was running just fine.
Dive Dive!:
So it was time for a deep deep dive. We copied the file OpsMgrConnector.Config.xml of the RMS and MS to another location and started to take a deep dive into them. Soon we noticed a difference: the file from the RMS contained the Connector information for the fully functional GW server, while the MS didn’t.
That’s strange! Since that GW server was installed by me using the GW Approval Tool, telling SCOM that the GW server should report to the MS and not the RMS. So this entrance should be found in the file located on the MS, not the RMS! I checked my installation document for that particular environment and indeed, I referred to the MS, not the RMS….
Time to run a PS-cmdlet which shows to WHAT MS the GW server is primarily talking to: Get-GatewayManagementServer | where {$_.Name -like '< GW SERVER NAME>'} | Get-PrimaryManagementServer.
And the output really puzzled me: the functional GW Server wasn’t talking to the MS but the RMS. Also the people running the firewall (TMG) told me that ONLY the RMS was being published, not the MS!
Now it all hit home! Wow!
The Solution:
I stopped the Health Service on the problematic test GW server, removed the GW server from the SCOM R2 Console, reran the GW Approval Tool, this time I referred to the RMS as the Management Server, adjusted the registry on the GW server in order to reflect the RMS and not the MS and restarted the Health Service on the GW.
BINGO!
All was working now!
Did the same for the problematic production GW server and hit the jackpot there as well!
However, some additional work needs to be done but that will be planned for the days to come:
Why? It is not good to have servers reporting to the RMS.
Puzzled:
Yes, I am still puzzled. WHY does the first functional GW server talk to the RMS instead of the MS, while I have ran the GW Approval Tool in such a manner that it should talk to the MS? Got the screen dumps showing it. Really felt stupid and taken by surprise. Also learned a valuable lesson: How to troubleshoot SCOM R2…
Credits:
While troubleshooting this issue many colleagues (Peer, Tim, Wim, Pieter-Jan and Maarten) tuned in. Also got some serious aid from the SCOM MVPs like Pete, Graham, Alexandre, Paul and Simon. Even KH assisted! A good experience it was!
Without their help, effort and time I would not have cracked it! Thank you guys! Much appreciated!
Some enhancements have been made, among them (I won’t list them all here, for detailed information check out the screen dump made from the MP Guide):
This MP is becoming better and better every time. And has become THE SHOWCASE what a MP is all about. A job well done Microsoft!
Changes in this update are: (taken from the MP guide): 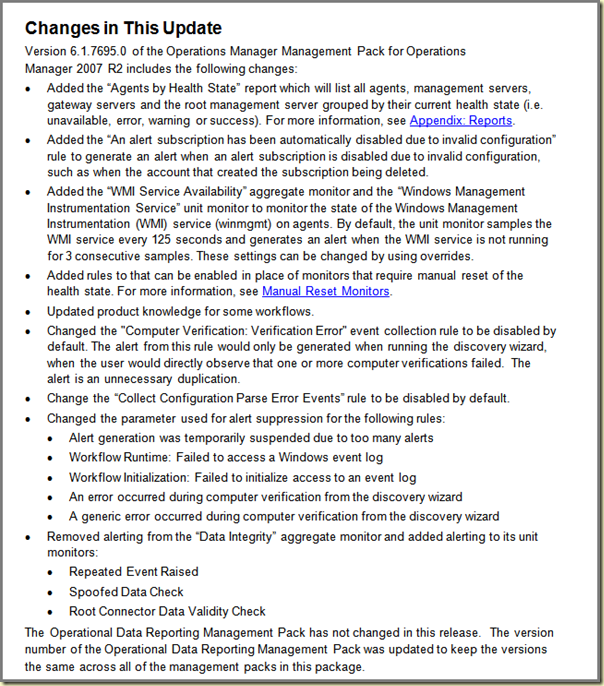
MP to be downloaded from here.
In the third posting of this series I will describe another new feature in OpsMgr vNext, Network Monitoring.
Until now network monitoring with SCOM (SP1 or R2) out of the box, is basic. When one requires better and deeper network monitoring additional (third party) MPs are needed. Some of them are commercial (Jalasoft or OpsLogix) another one is open source (xSNMP Suite). On top of it all, the SCOM component used for network monitoring isn’t very robust nor scalable either.
So Microsoft has rewritten this component completely for OpsMgr vNext. And they have done a good job! Let’s take a deeper look. 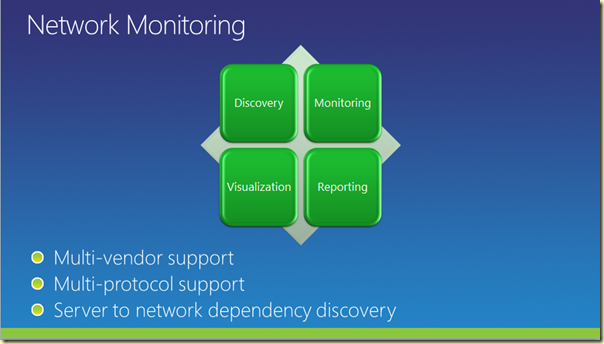
This isn’t just a slide with some marketing slogans. The new Network Monitoring module of OpsMgr vNext is based on these three pillars. And it really rocks!
Microsoft has made huge investments in order to help the infrastructure owners and application owners by providing enough information about the network so they know whether the issue they are experiencing is network related or not.
So this means the monitored servers will show their dependencies of the network devices as well? Good question! And the answer is YES! Aka Server To Switch Fabric. 360 app view!!!! Take a look here: 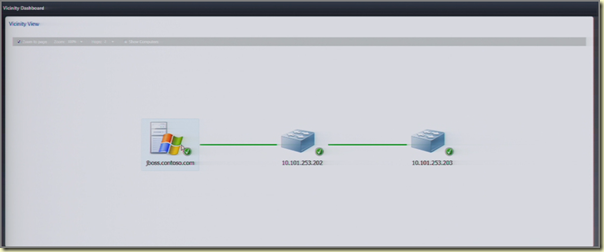
(Screen dump taken from video, so the quality isn’t that well.)
And here: 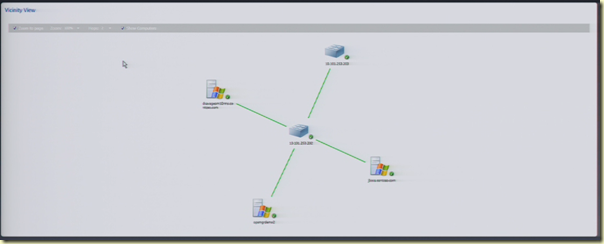
(Screen dump taken from video, so the quality isn’t that well.)
Isn’t that sweet? Again the 360 View is present here. A network device centric View can be used or a server centric View. Both will show the dependencies!
A cool demo was given during the session. With the unreleased beta (!) version of OpsMgr vNext the network of Tech-Ed Berlin 2010 was being monitored, based on the Read-Only SNMP string. Within 10 to 15 minutes the devices were discovered. (Primary C-device was used, interrogated the primary C-device and crawled the vicinity view, in order to pick up all the network devices connected to it).
Big change compared to today, where the community strings is a property of that object. In OpsMgr vNext it will store the community string as a RunAs Account. One may use multiple community strings in order to discover the network devices. Per network devices the available community strings will be used and store the one for the network device that work.
The Discovery Wizard for the network devices allows multiple filters and schedules as well. So it is very flexible aid. Some screen dumps:
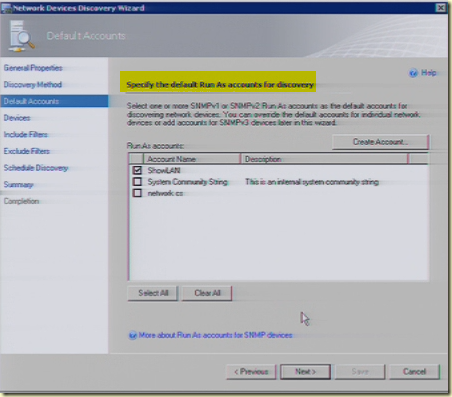
C Devices: 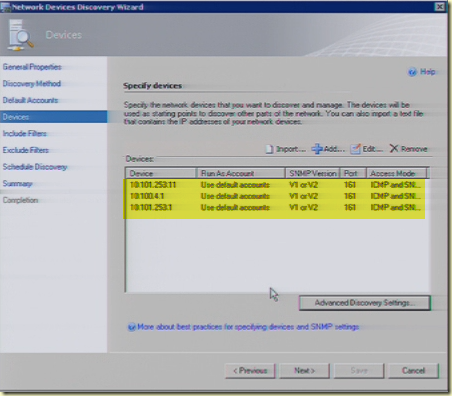
(Screen dump taken from video, so the quality isn’t that well.)
Besides that, the Look & Feel are the same as for computers monitored by OpsMgr as we know it today. So for the network devices Health Explorer, Alert View, State View and the lot will be found in OpsMgr vNext: 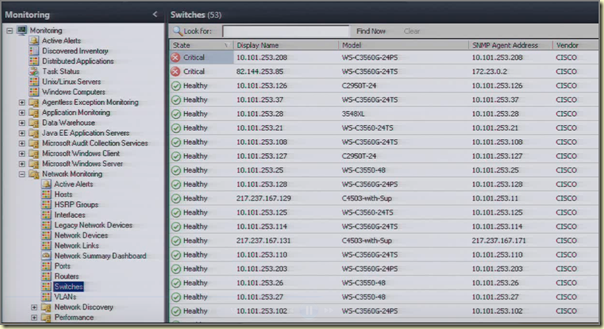
And on top of it all, some good Dashboards are there as well: 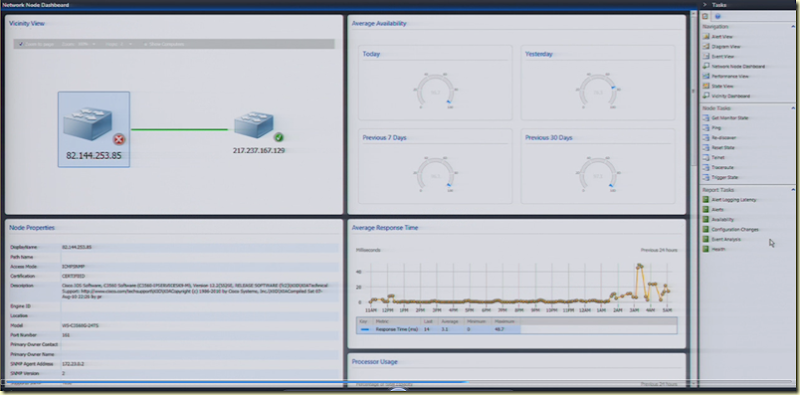
(Screen dump taken from video, so the quality isn’t that well.)
And: 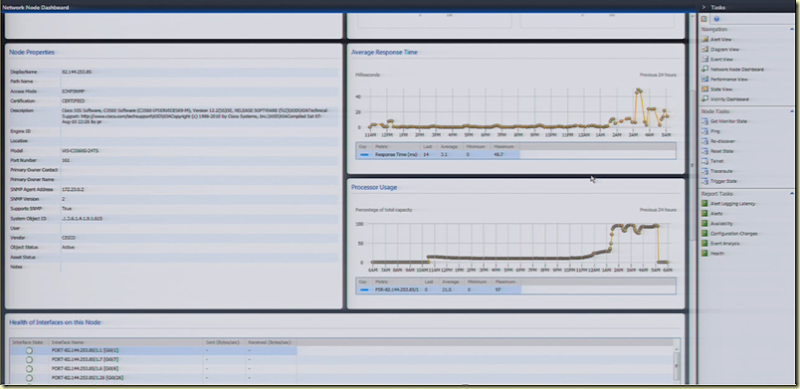
(Screen dump taken from video, so the quality isn’t that well.)
And: 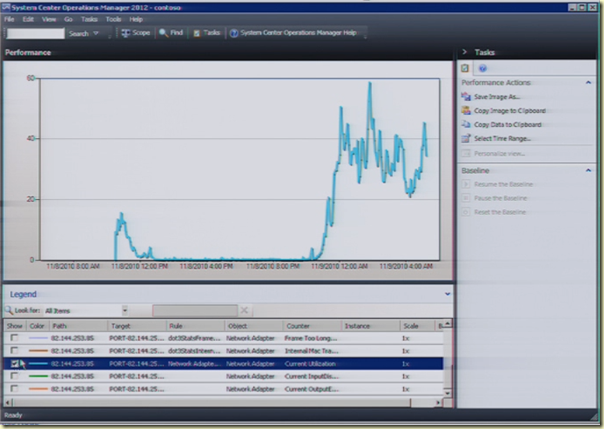
(Screen dump taken from video, so the quality isn’t that well.)
Also Summary Views are available: 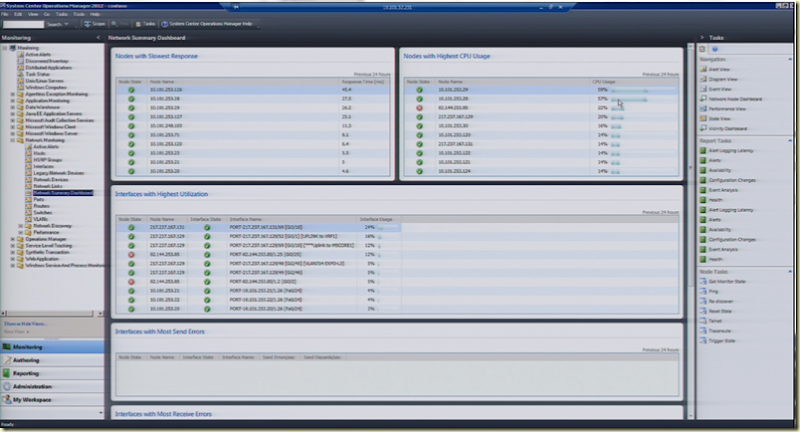
(Screen dump taken from video, so the quality isn’t that well.)
The same View as shown above, but now in the Web Console (based on Sliverlight):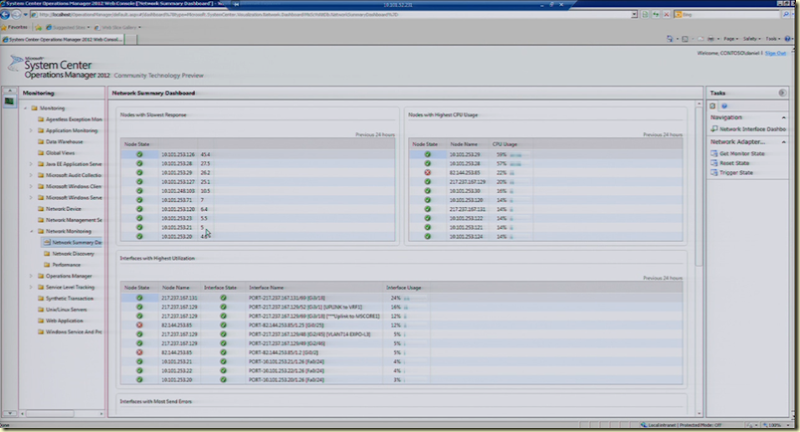
(Screen dump taken from video, so the quality isn’t that well.)
So this means it can be used in SharePoint as well.
This is one of new features of OpsMgr vNext that’s really awesome! Much has been said about how SCOM monitors network devices today. And Microsoft has listened to it, as demonstrated at Tech-Ed EMEA 2010. This new way of network monitoring, in conjunction with the dependencies and the cool dashboards, will make OpsMgr vNext ready for the next era of Monitoring. Can’t wait until OpsMgr vNext goes RTM!
The next and last posting in this series will be about the timeline and a total wrap up of the whole session presented at Tech-Ed.